异常检测(anomaly detection) - 吴恩达机器学习基于python
1 多元高斯分布模型
1.1 算法步骤
- 对于给定的数据集,针对每个特征计算 μ \mu μ(均值)和 Σ \Sigma Σ(协方差)
μ j = 1 m ∑ i = 1 m x j ( i ) \mu_j=\frac{1}{m}\sum_{i=1}^{m}x_j^{(i)} μj=m1i=1∑mxj(i)
Σ = 1 m X T X \Sigma=\frac{1}{m}X^TX Σ=m1XTX - 根据获得的 μ \mu μ(均值)和 Σ \Sigma Σ(协方差),给定新的训练集,根据模型计算p(x)
p ( x ) = 1 ( 2 π ) n 2 ∣ Σ ∣ 1 2 e x p ( − 1 2 ( x − μ ) T Σ − 1 ( x − μ ) ) p(x) = \frac{1}{(2\pi)^\frac{n}{2}|\Sigma|^\frac{1}{2}}exp(-\frac{1}{2}(x-\mu)^T\Sigma^{-1}(x-\mu)) p(x)=(2π)2n∣Σ∣211exp(−21(x−μ)TΣ−1(x−μ))
原高斯分布模型
p ( x ) = ∏ j = 1 n p ( x j ; μ j , σ j 2 ) = ∏ j = 1 n 1 ( 2 π ) 1 2 σ e x p ( − ( x j − μ j ) 2 2 σ j 2 ) p(x) =\prod_{j=1}^{n}p(x_j;\mu_j,\sigma_j^2)=\prod_{j=1}^{n} \frac{1}{(2\pi)^\frac{1}{2}\sigma}exp(-\frac{(x_j-\mu_j)^2}{2\sigma^2_j}) p(x)=j=1∏np(xj;μj,σj2)=j=1∏n(2π)21σ1exp(−2σj2(xj−μj)2)
其中, σ j 2 = 1 m ∑ i = 1 m ( x j ( i ) − μ j ) 2 \sigma_j^2=\frac{1}{m}\sum_{i=1}^{m}(x_j^{(i)}-\mu_j)^2 σj2=m1∑i=1m(xj(i)−μj)2(方差)
这里,不使用原高斯分布模型,而是使用多元高斯分布模型进行异常检测
- 选择一个 ϵ \epsilon ϵ,将 p ( x ) = ϵ p(x)=\epsilon p(x)=ϵ作为判定边界
2 2D data
import scipy.io as sio
mat = sio.loadmat(r'D:\python_try\5. AndrewNg_ML\data\anomaly detection\ex8data1.mat')
# print(mat.keys()) # 查看数据组成成分
X = mat.get('X')
# X.shape # 查看数据维度
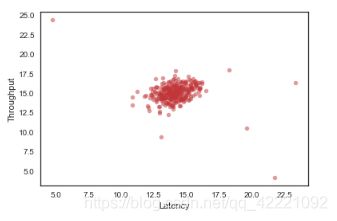
2.1 visualize training data
import seaborn as sns
import matplotlib.pyplot as plt
# 画布设置
sns.set(context="notebook", style="white", palette=sns.color_palette("RdBu"))
sns.regplot('Latency','Throughput',
             data=pd.DataFrame(X, columns=['Latency','Throughput']),
             fit_reg=False,
             scatter_kws={"s": 30, "alpha":0.5})
from sklearn.cross_validation import train_test_split # 划分数据集
Xval, Xtest, yval, ytest = train_test_split(mat.get('Xval'),
                                           mat.get('yval').ravel(),
                                           test_size=0.5)
2.2 estimate multivariate Gaussian parameters μ \mu μ and Σ \Sigma Σ
import numpy as np

mu = X.mean(axis=0)
cov = np.cov(X.T)
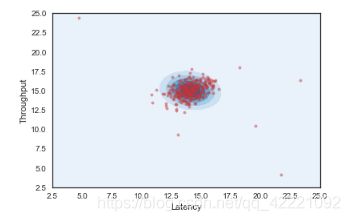
画 出 高 斯 分 布 概 率 图 画出高斯分布概率图 画出高斯分布概率图
高斯概率分布图参考网址
from scipy import stats

x, y = np.mgrid[2.5:25:.01, 2.5:25:.01]
pos = np.dstack((x, y))
rv = stats.multivariate_normal(mu, cov)
fig, ax = plt.subplots()

# plot probability density
ax.contourf(x, y, rv.pdf(pos), cmap='Blues')

# plot original data points
sns.regplot('Latency', 'Throughput',
           data=pd.DataFrame(X, columns=['Latency', 'Throughput']),
           fit_reg=False,
           ax=ax,
           scatter_kws={"s":15,
                        "alpha":0.5})
plt.show()
2.3 select threshold ϵ \epsilon ϵ
- use training set X X X to model the multivariate Gaussian
- use cross validation set ( X v a l , y v a l ) (Xval, yval) (Xval,yval) to find the best ϵ \epsilon ϵ by finding the best
F-score
from sklearn.metrics import f1_score, classification_report

def select_threshold(X, Xval, yval):
    '''
       使用交叉验证数据找到最优的epsilon
       Returrn:
          e: best epsilon with highest f-score
          f-score: such best f-score
    '''
    # use training data create multivariate model
    mu = X.mean(axis=0)
    cov = np.cov(X.T)
    multi_normal = stats.multivariate_normal(mu, cov)

    # use CV data for fining turning hyper parameters
    pval = multi_normal.pdf(Xval)

    # set up epsilon candidates
    epsilon = np.linspace(np.min(pval), np.max(pval), num=10000)

    # calculate f=score
    fs = []
    for e in epsilon:
        y_pred = (pval <= e).astype('int')
        fs.append(f1_score(yval, y_pred))

    # find the best f-score
    argmax_fs = np.argmax(fs)

    return epsilon[argmax_fs], fs[argmax_fs]

e, fs = select_threshold(X, Xval, yval)
def predict(X, Xval, e, Xtest, ytest):
    '''
       用最优的epsilon,结合X, Xval预测Xtest
       with optimal epsilon, combine X, Xval, and predict Xtest
       Returns:
           multi_normal: multivariate normal model
           y_predict: prediction of test data
    '''

    Xdata = np.concatenate((X, Xval), axis=0)

    mu = Xdata.mean(axis=0)
    cov = np.cov(Xdata.T)
    multi_normal = stats.multivariate_normal(mu, cov)

    # calculate probability of test data
    pval = multi_normal.pdf(Xtest)
    y_pred = (pval <= e).astype('int')

    print(classification_report(ytest, y_pred))

    return multi_normal, y_pred

multi_normal, y_pred = predict(X, Xval, e, Xtest, ytest)
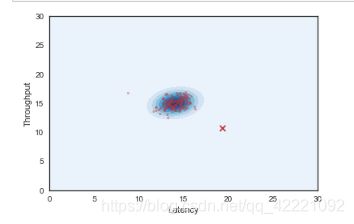
2.4 visualize anomaly detection
data = pd.DataFrame(Xtest, columns=['Latency', 'Throughput'])
data['y_pred'] = y_pred

# create a grid for graphing
x, y = np.mgrid[0:30:.01, 0:30:.01]
pos = np.dstack((x,y))

fig, ax = plt.subplots()

# plot probability density
ax.contourf(x, y,multi_normal.pdf(pos), cmap='Blues')

# plot original Xval points
sns.regplot('Latency', 'Throughput',
            data=data,
            fit_reg = False,
            ax=ax,
            scatter_kws={"s":10,
                        'alpha': 0.4})

# mark the predicted anomoly of CVdata
anamoly_data = data[data['y_pred']==1]
ax.scatter(anamoly_data['Latency'], anamoly_data['Throughput'], marker='x', s=50)
plt.show()


