使用Keras构建神经网络进行Mnist手写字体分类
稍微整理一下在努力学(kan)习(dong)Keras的Hello World程序的一些参考文档和思考。
安装
安装的时候需要
Keras中文文档 / Keras安装和配置指南(Windows)
http://keras-cn.readthedocs.io/en/latest/getting_started/keras_windows/
对于Keras的介绍很详细(就是看不懂)
在这一步要是安装目录存在中文的话会报错
解决方法参考
http://blog.csdn.net/all_over_servlet/article/details/45112221
基本概念
我能看懂的最简单的概念
卷积层
convout1=Convolution2D(nb_filters[0], kernel_size[0], kernel_size[1],
                        border_mode='valid',
                        input_shape=input_shape)
model.add(convout1)
我们是如何识别出一个数字的呢?当然是因为这个数字不同于别的数字的特点,对于像MNist这样的数据,特点自然来自于明暗交界的地方。一片黑的区域不会告诉我们任何有用的信息,同样地,一片白的区域也不会告诉我们任何有用的信息。同样,数字的笔画粗细对我们的识别也没有太大的作用。这些都是我们识别过程中会遇到的问题,而其中临近像素之间有规律地出现相似的状态就是局部相关性。
那么如何消除这些局部相关性呢,使我们的特征变得少而精呢?卷积就是一种很好地方法。它只考虑附近一块区域的内容,分析这一小片区域的特点,这样针对小区域的算法可以很容易地分析出区域内的内容是否相似。如果再加上Pooling层(可以理解为汇集,聚集的意思,后面不做翻译),从附近的卷积结果中再采样选择一些高价值的合成信息,丢弃一些重复低质量的合成信息,就可以做到对特征信息的进一步处理过滤,让特征向少而精的方向前进。
作者:冯超
链接:https://zhuanlan.zhihu.com/p/21609512
来源:知乎
model.add(Activation("sigmoid"))激活函数,通过函数把数据的特征保留并映射出来,加入非线性因素,线性的模型可能无法很好地表达关联。
池化层
model.add(MaxPooling2D(pool_size=pool_size))
对于卷积层输出map的每个不重叠n*n区域,选取每个区域中的最大值(max-pooling)或是平均值(mean-pooling),用这个值代表这个区域的值
- 增强鲁棒性
- 降维
全连接层
model.add(Dense(84))Keras中的全连接层称为Dense
全连接层直接将前一层的输出展开为一维向量
Drop out
model.add(Dropout(0.5))在训练过程中以一定概率1-p将隐含层节点的输出值清0,而用bp更新权值时,不再更新与该节点相连的权值,是一种预防过学习的机制
模拟人脑,神经元并不是完全连接的(捂脸)
还是给链接吧
http://blog.csdn.net/stdcoutzyx/article/details/49022443
代码
Minit手写字体分类
https://github.com/julienr/ipynb_playground/blob/master/keras/convmnist/keras_cnn_mnist_v1.ipynb
可以参考对cifar10_cnn的解释理解
https://zhuanlan.zhihu.com/p/22918818
数据优化
SGD
    sgd = SGD(lr=0.05, decay=1e-6, momentum=0.9, nesterov=True)
    model.compile(loss='categorical_crossentropy',
              optimizer=sgd,metrics=['accuracy'])
随机梯度下降法,支持动量参数,支持学习衰减率,支持Nesterov动量
ImageDataGenerator
   datagen = ImageDataGenerator(
        featurewise_center=False,
        samplewise_center=False,
        featurewise_std_normalization=False,
        samplewise_stZd_normalization=False,
        zca_whitening=False,
        rotation_range=0,
        width_shift_range=0.1,
        height_shift_range=0.1,
        horizontal_flip=False,
        vertical_flip=False)
从ImageDataGenerator的参数名字上我们大致可以推测出这个生成器都做了哪些数据提升,包括去中心化等预处理,旋转,水平位移,垂直位移,水平翻转等。
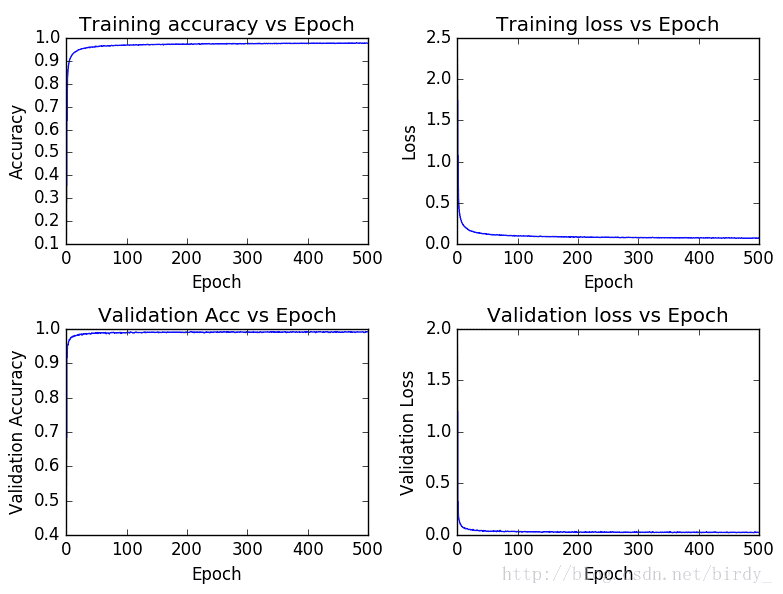
可视化
误差变化曲线
http://blog.csdn.net/csmqq/article/details/51424919
# -*- coding: utf-8 -*-
"""
Created on Sat May 21 22:26:24 2016
@author: Shemmy
"""

def figures(history,figure_name="plots"):
    """ method to visualize accuracies and loss vs epoch for training as well as testind data\n
        Argumets: history     = an instance returned by model.fit method\n
                  figure_name = a string representing file name to plots. By default it is set to "plots" \n
       Usage: hist = model.fit(X,y)\n              figures(hist) """
    from keras.callbacks import History
    if isinstance(history,History):
        hist     = history.history
        epoch    = history.epoch
        acc      = hist['acc']
        loss     = hist['loss']
        val_loss = hist['val_loss']
        val_acc  = hist['val_acc']
        plt.figure(1)

        plt.subplot(221)
        plt.plot(epoch,acc)
        plt.title("Training accuracy vs Epoch")
        plt.xlabel("Epoch")
        plt.ylabel("Accuracy")

        plt.subplot(222)
        plt.plot(epoch,loss)
        plt.title("Training loss vs Epoch")
        plt.xlabel("Epoch")
        plt.ylabel("Loss")

        plt.subplot(223)
        plt.plot(epoch,val_acc)
        plt.title("Validation Acc vs Epoch")
        plt.xlabel("Epoch")
        plt.ylabel("Validation Accuracy")

        plt.subplot(224)
        plt.plot(epoch,val_loss)
        plt.title("Validation loss vs Epoch")
        plt.xlabel("Epoch")
        plt.ylabel("Validation Loss")
        plt.tight_layout()
        plt.savefig(figure_name)
    else:
        print ('Input Argument is not an instance of class History')

figures(hist)
各数字正确率
"""
@ birdy&C
"""

y_hat = model.predict_classes(X_test)
test_all=[]
test_wrong=[]
all_count=np.zeros((1,10))
right_count=np.zeros((1,10))
for im in zip(X_test,y_hat,y_test):
    test_all=test_all + [tuple(im)]
    if im[1] != im[2]:
        test_wrong = test_wrong+[tuple(im)]
    else:
        right_count[0,im[2]]= right_count[0,im[2]]+1;
    all_count[0,im[2]]=all_count[0,im[2]]+1;

for i in xrange(10):
    print ('number'+ str(i)+ ': '+ str( right_count[0,i] / all_count[0,i]))
识别错误图片
"""
@ bbliao
"""

y_hat = model.predict_classes(X_test)
test_wrong = [im for im in zip(X_test,y_hat,y_test) if im[1] != im[2]]

plt.figure(figsize=(10, 20))
for ind, val in enumerate(test_wrong[:200]):
    plt.subplots_adjust(left=0, right=1, bottom=0, top=1)
    plt.subplot(10, 20, ind + 1)
    im = 1 - val[0].reshape((28,28))
    plt.axis("off")
    plt.text(0, 0, val[2], fontsize=14, color='blue')
    plt.text(8, 0, val[1], fontsize=14, color='red')
    plt.imshow(im, cmap='gray')

plt.show()

test_wrong = [im for im in zip(X_test,y_hat,y_test) if im[1] != im[2]]

plt.figure(figsize=(10, 20))
for ind, val in enumerate(test_wrong[:200]):
    plt.subplots_adjust(left=0, right=1, bottom=0, top=1)
    plt.subplot(10, 20, ind + 1)
    im = 1 - val[0].reshape((28,28))
    plt.axis("off")
    plt.text(0, 0, val[2], fontsize=14, color='blue')
    plt.text(8, 0, val[1], fontsize=14, color='red')
    plt.imshow(im, cmap='gray')

plt.show()
读取图片(白底黑字)
"""
@ birdy&C
"""
#load the trained model
model.load_weights('lenet_mnist_iter_xy.h5')

#get the picture
X=mpimg.imread('number.jpg')
X_train1=255-X[:,:,1]
X_train1 = X_train1.reshape(1,1, 28, 28)
# Type Cast & normalize
X_train1 = X_train1.astype('float32')
X_train1 /= 255
t=model.predict_classes(X_train1)
print("prediction:",t)