Python绘图之Matplotlib
Matplotlib是Pyhton中最基本的可视化工具,官网地址:https://matplotlib.org/
文章目录
- 一、认识绘图
- 图
- 坐标系和子图
- 坐标轴
- 刻度
- 总结
- 二、绘图的基本操作
- 三、常见图形的绘制
一、认识绘图
绘图之前,要调用其库
import matplotlib
为简化代码,有如下操作:
import matplotlib as mpl
import matplotlib.pyplot as plt
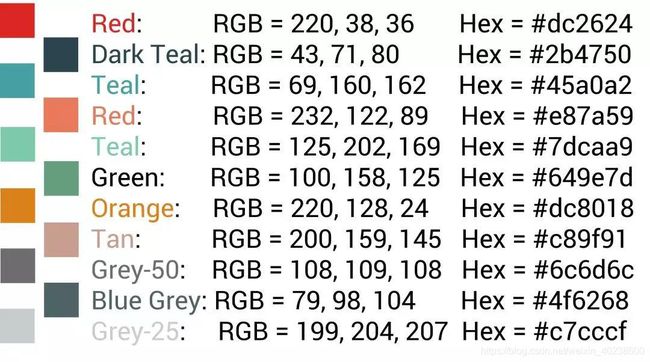
参考颜色代码,
r_hex = '#dc2624'     # red,       RGB = 220,38,36
dt_hex = '#2b4750'    # dark teal, RGB = 43,71,80
tl_hex = '#45a0a2'    # teal,      RGB = 69,160,162
r1_hex = '#e87a59'    # red,       RGB = 232,122,89
tl1_hex = '#7dcaa9'   # teal,      RGB = 125,202,169
g_hex = '#649E7D'     # green,     RGB = 100,158,125
o_hex = '#dc8018'     # orange,    RGB = 220,128,24
tn_hex = '#C89F91'    # tan,       RGB = 200,159,145
g50_hex = '#6c6d6c'   # grey-50,   RGB = 108,109,108
bg_hex = '#4f6268'    # blue grey, RGB = 79,98,104
g25_hex = '#c7cccf'   # grey-25,   RGB = 199,204,207
Matplotlib包含两类元素:
基础类:线(line)、点(marker)、文字(text)、图例(legend)、网格(grid)、标题(title)、图片(image)
容器类:图(figure)、坐标系(axes)、坐标轴(axis)和刻度(tick)
大致关系如下:
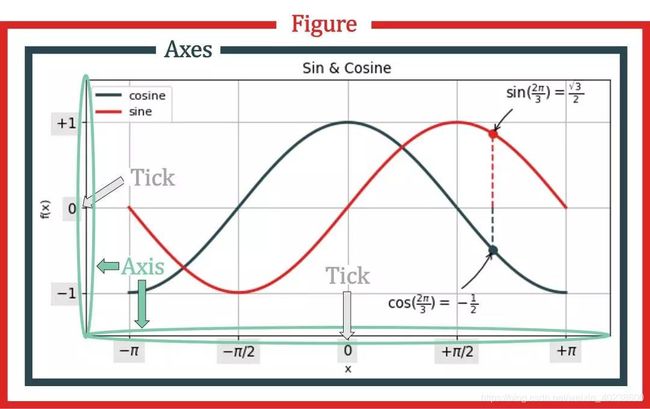
可以看出:
- 图(figure)包含坐标系(axes)
- 坐标系(axes)是由坐标轴组成(axis),包括横坐标和纵坐标
- 坐标轴上有刻度
代码展示如下:
  fig=plt.figure()#图
  ax=fig.add_subplot(111)#坐标系
  plt.show()
  xax=ax.xaxis#横坐标
  yax=ax.yaxis#纵坐标
创造完四个容器后,然后我们添加基础元素,
- 往坐标轴和刻度上添加标签
- 在坐标系中添加线、点、网格、图例和文字
- 在图中添加图例
如上图所示
图
图是整个绘图层级的顶部,图的一些基本操作:
1、图中添加文字或图片
添加文字,用plt.text(),具体如下:
- 第一个和第二个参数表示文字所在的横坐标和纵坐标
- 第三个参数表示所要展示的文字
- ha,va表示纵向和横向的位置
- size表示字体的大小
- alpha设置字体的透明度(0.5半透明)
代码如下:
    fig=plt.figure()#图
    text=plt.text(0.5,0.5,'Mygirl',ha='center',va='center',size=20,alpha=.5)#设置参数
    plt.xticks([])#去掉x轴刻度
    plt.yticks([])#去掉y轴刻度
    plt.show()
pip install pillow
图像是由像素组成的一个二维矩阵,每个元素是一个RGB值,R-红色,G-绿色,B-蓝色,RGB三个颜色通道的变化和叠加得到各种颜色,可使用Numpy来表示。
代码,
import matplotlib.pyplot as plt
import numpy as np
from PIL import Image

fig = plt.figure()
plt.xticks([])
plt.yticks([])
ax = fig.add_subplot(111)
im = np.array(Image.open('MyGirl.jpg'))
ax.set_xlabel('MyGirl')
plt.imshow(im)
plt.show()

手绘版,代码参考 https://blog.csdn.net/acsuccess/article/details/88085045:

2、图中添加折线
plt.plot() 用来画折线,代码:
plt.figure()
plt.plot([0, 1, 2, 3], [0, 1, 2, 3])
plt.show()
图片:

由此,我们可以看到画图是在图(figure)中进行的,首先要定义图 plt.figure()
坐标系和子图
首先我们来看子图,
subplot(rows,colums,i-th plots)
其中,rows-表示行 colums-表示列 i-th plots-表示第几副图
plt.subplot(2, 1, 1)
plt.xticks([]), plt.yticks([])
plt.text(0.5, 0.5, 'the first subplot', ha='center', va='center', size=30, alpha=0.5)

plt.subplot(2, 1, 2)
plt.xticks([]), plt.yticks([])
plt.text(0.5, 0.5, 'the second subplot', ha='center', va='center', size=30, alpha=0.5)

plt.show()
- 用
gridspec包加上subplot() - 用
plt.axes()
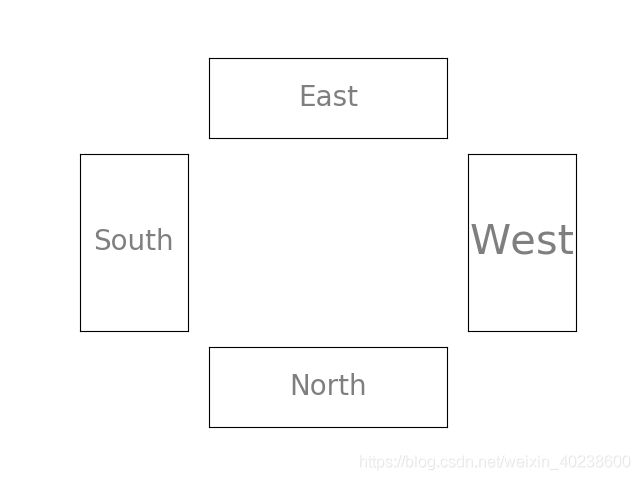
1、第一种形式:不规则网格
代码:
import matplotlib.gridspec as gridspec
G = gridspec.GridSpec(4, 4)#将整幅图分成4乘4份分给G
ax1 = plt.subplot(G[0, 1:-1])#图的第一行,第2到第4列
plt.xticks([]), plt.yticks([])#删除坐标系上的刻度
plt.text(0.5, 0.5, 'East', ha='center', va='center', size=20, alpha=0.5)

ax2 = plt.subplot(G[1:3, 0])
plt.xticks([]), plt.yticks([]
plt.text(0.5, 0.5, 'South', ha='center', va='center', size=20, alpha=0.5)

ax3 = plt.subplot(G[1:3, -1])
plt.xticks([]), plt.yticks([])
plt.text(0.5, 0.5, 'West', ha='center', va='center', size=30, alpha=0.5)

ax4 = plt.subplot(G[-1, 1:-1])
plt.xticks([]), plt.yticks([])
plt.text(0.5, 0.5, 'North', ha='center', va='center', size=20, alpha=0.5)

plt.show()
plt.axes([l,b,w,h]), 相关参数含义如下:
- l代表坐标系左边到图的左边的距离
- b代表坐标系底边到图的底边的距离
- w代表坐标系的宽度
- h代表坐标系的高度
代码:
plt.axes([0.1, 0.1, 0.8, 0.8])
plt.xticks([]), plt.yticks([])
plt.text(0.5, 0.5, 'ONE', ha='center', va='center', size=20, alpha=0.7)

plt.axes([0.2, 0.2, 0.25, 0.25])
plt.xticks([]), plt.yticks([])
plt.text(0.5, 0.5, '1', ha='center', va='center', size=11, alpha=0.7)

plt.axes([0.5, 0.2, 0.25, 0.25])
plt.xticks([]), plt.yticks([])
plt.text(0.5, 0.5, '2', ha='center', va='center', size=11, alpha=0.7)

plt.axes([0.2, 0.6, 0.25, 0.25])
plt.xticks([]), plt.yticks([])
plt.text(0.5, 0.5, '3', ha='center', va='center', size=11, alpha=0.7)

plt.axes([0.5, 0.6, 0.25, 0.25])
plt.xticks([]), plt.yticks([])
plt.text(0.5, 0.5, '4', ha='center', va='center', size=11, alpha=0.7)

plt.show()
plt.axes([0.1, 0.1, 0.4, 0.4])
plt.xticks([]), plt.yticks([])
plt.text(0.3, 0.1, 'Follow', ha='left', va='center', size=20, alpha=0.7)

plt.axes([0.2, 0.2, 0.4, 0.4])
plt.xticks([]), plt.yticks([])
plt.text(0.3, 0.1, 'your', ha='left', va='center', size=20, alpha=0.7)

plt.axes([0.3, 0.3, 0.4, 0.4])
plt.xticks([]), plt.yticks([])
plt.text(0.3, 0.1, 'heart', ha='left', va='center', size=20, alpha=0.7)

plt.axes([0.4, 0.4, 0.4, 0.4])
plt.xticks([]), plt.yticks([])
plt.text(0.3, 0.1, 'and', ha='left', va='center', size=20, alpha=0.7)

plt.axes([0.5, 0.5, 0.4, 0.4])
plt.xticks([]), plt.yticks([])
plt.text(0.3, 0.1, 'keep', ha='left', va='center', size=20, alpha=0.7)

plt.show()
坐标轴
一个坐标系(Axes),通常是两维,有两条坐标轴(Axis):
- 横轴:XAxis
- 纵轴:YAxis
每个坐标轴包含两个元素:
-
容器类元素【刻度】:包括刻度本身和刻度标签
-
基础类元素【标签】:包含坐标轴标签
 fig, ax = plt.subplots()#同时生成图和坐标系
 ax.set_xlabel('Label on x-axis')  # 设置x轴标签
 ax.set_ylabel('Label on y-axis')  # 设置y轴标签
 #对x轴进行操作
 for label in ax.xaxis.get_ticklabels():  # 处理刻度对象里的刻度标签
     label.set_color('#2b4750')  # 标签颜色
     label.set_rotation(45)  # 标签旋转45度
     label.set_fontsize(10)  # 标签字体大小为20
 for line in ax.xaxis.get_ticklines():
     line.set_markersize(5)
     line.set_markeredgewidth(5)
     line.set_color('#dc8018')
 #对y轴进行操作
 for line in ax.yaxis.get_ticklines():  # 对标签的刻度线进行设置
     line.set_color('#dc2624')  # 颜色设置为红色
     line.set_markersize(5)  # 标记的长度
     line.set_markeredgewidth(5)  #标记宽度
 plt.show()
刻度
刻度总结起来就是:
- 一条短线(刻度本身)
- 一串字符(刻度标签)
为了显示不同类型的刻度,首先定义一个setup(ax)函数,主要功能有:
- 去除左纵轴、右纵轴和上纵轴
- 去除y轴上的刻度
- 将x轴的刻度定位在轴底
- 设置主刻度和副刻度的长度和宽度
- 设置x轴和y轴的边界
- 将图中的patch设成完全透明
代码:
fig, axes = plt.subplots(nrows=2, ncols=3, figsize=(8, 5))

axes[0, 0].set_title('Original')  # 第一行第一个子图加标题

axes[0, 1].spines['right'].set_color('none')  # 第一行第二个子图去掉右纵轴
axes[0, 1].spines['left'].set_color('none')  # 第一行第二个子图去掉左纵轴
axes[0, 1].spines['top'].set_color('none')  # 第一行第二个子图去掉上纵轴
axes[0, 1].set_title('Handle Spines')  # 第一行第二个子图加标题

axes[0, 2].yaxis.set_major_locator(ticker.NullLocator())  # 第一行第三个子图去掉y轴上的刻度
axes[0, 2].xaxis.set_ticks_position('bottom')
axes[0, 2].set_title('Handle Tick Labels')

axes[1, 0].tick_params(which='major', width=2)  # 主刻度线
axes[1, 0].tick_params(which='major', length=10)
axes[1, 0].tick_params(which='minor', width=0.75)  # 次刻度线
axes[1, 0].tick_params(which='minor', length=2.5)
axes[1, 0].set_title('Handle Tick Length/Width')

axes[1, 1].set_xlim(0, 5)  # 设置x轴的范围
axes[1, 1].set_ylim(0, 1)  # 设置y轴的范围
axes[1, 1].set_title('Handle Axis Limit')

axes[1, 2].patch.set_color('yellow')
axes[1, 2].patch.set_alpha(0.6)
axes[1, 2].set_title('Handle Patch color')

plt.tight_layout()  # 是图像变得更加紧凑
plt.show()
NullLocator:空刻度MultipleLocator(a):刻度间隔为aFixedLocator(a):刻度位置由数组决定LinearLocator(a):刻度数目=a,a为标量IndexLocator(b,o):刻度间隔=标量b,偏移量=标量oAutoLocator():根据默认值决定MaxNLocator(a):最大刻度数目=标量aLogLocator(b,n):基数=标量b,刻度数目=标量n
其中,
np.linspace(start,stop,number,endpoint,retstep) 相关参数如下:
-
start-起点
-
stop-终点
-
number-生成的样本点个数
-
endpoint=True时,包括stop;
endpoint=False时,不包括stop -
retstep=True时,输出一个元组,而元组的两个元素分别是需要生成的数列和数列的步进差值
代码:
import matplotlib.pyplot as plt
import numpy as np
#from PIL import Image
#import matplotlib.gridspec as gridspec
import matplotlib.ticker as ticker

def setup(ax):
    ax.spines['right'].set_color('none')
    ax.spines['left'].set_color('none')
    ax.spines['top'].set_color('none')
    ax.yaxis.set_major_locator(ticker.NullLocator())
    ax.xaxis.set_ticks_position('bottom')


    ax.tick_params(which='major', width=2)
    ax.tick_params(which='major', length=10)
    ax.tick_params(which='minor', width=0.75)
    ax.tick_params(which='minor', length=2.5)

    ax.set_xlim(0, 5)
    ax.set_ylim(0, 1)


    ax.patch.set_alpha(0.0)

plt.figure(figsize=(8, 6))
n = 8
#  Null Locator
ax = plt.subplot(n, 1, 1)
setup(ax)
ax.xaxis.set_major_locator(ticker.NullLocator())# 主刻度为空
ax.xaxis.set_minor_locator(ticker.NullLocator())# 次刻度为空
ax.text(0, 0.1, 'NullLocator()', fontsize=14, transform=ax.transAxes)# 加文本
# Multiple Locator
ax = plt.subplot(n, 1, 2)
setup(ax)
ax.xaxis.set_major_locator(ticker.MultipleLocator(0.5))# 主刻度间隔0.5
ax.xaxis.set_minor_locator(ticker.MultipleLocator(0.1))# 次刻度间隔0.1
ax.text(0, 0.1, 'MultipleLocator(0.5)', fontsize=14, transform=ax.transAxes)
# Fixed Locator
ax = plt.subplot(n, 1, 3)
setup(ax)
major = [0, 1, 5]
ax.xaxis.set_major_locator(ticker.FixedLocator(major))
minors = np.linspace(0, 1, 11,endpoint=True)
ax.xaxis.set_minor_locator(ticker.FixedLocator(minors))
ax.text(0, 0.1, 'FixedLocator([0,1,5])', fontsize=14, transform=ax.transAxes)
#Liner locator
ax=plt.subplot(n, 1, 4)
setup(ax)
ax.xaxis.set_major_locator(ticker.LinearLocator(3))
ax.xaxis.set_minor_locator(ticker.LinearLocator(31))
ax.text(0,0.1,'Liner Locator(numberticks=3)',fontsize=14,transform=ax.transAxes)
#Index Locator
ax=plt.subplot(n, 1, 5)
setup(ax)
ax.plot(range(0,5), [0]*5, color='white')
ax.xaxis.set_major_locator(ticker.IndexLocator(base=.5, offset=.25))
ax.text(0, 0.1, 'Index Locator(base=.5, offset=.25)', fontsize=14, transform= ax.transAxes)
# Autor Locator
ax=plt.subplot(n,1,6)
setup(ax)
ax.xaxis.set_major_locator(ticker.AutoLocator())
ax.xaxis.set_minor_locator(ticker.AutoLocator())
ax.text(0, 0.1, 'AutorLocator()', fontsize=14, transform=ax.transAxes)
# MaxN Locator
ax=plt.subplot(n, 1, 7)
setup(ax)
ax.xaxis.set_major_locator(ticker.MaxNLocator(4))
ax.xaxis.set_minor_locator(ticker.MaxNLocator(40))
ax.text(0, 0.1, 'MaxLocator=4', fontsize=14, transform=ax.transAxes)
# Log Locator
ax=plt.subplot(n, 1, 8)
setup(ax)
ax.set_xlim(10**3, 10**10)
ax.set_xscale('log')
ax.xaxis.set_major_locator(ticker.LogLocator(base=10, numticks=15))
ax.text(0, 0.1, 'LogLocator(base=10, numtickes=15)', fontsize=15, transform=ax.transAxes)
# push the top of axes outside the figure because we only show the bottom spine.
plt.subplots_adjust(left=0.05, right=0.95, bottom=0.05, top=1.05)
plt.show()
总结
由此看来,四种容器以及它们之间的层级关系:
图(Figure)——>坐标系(Axes)——>坐标轴(Axis)——>刻度(Ticks)
绘制一幅图,不仅需要在容器里添加基础元素,比如线(line),点(marker),文字(text),图例(legend),网格(grid),标题(title),图片(image)等,具体来说,
- 画一条线,用
plt.plot()或ax.plot() - 画散点图,用
plt.scatter()或ax.scatter() - 添加文字,用
plt.text()或ax.text() - 添加图例,用
plt.legend()或ax.legend() - 添加图片,用
plt.imshow()或ax.imshow()
二、绘图的基本操作
以折线图为例,通过使用绘图的各种操作,力求在绘图的深度上达到完美。
画一幅标准普尔500指数在2007-2010的走势图
首先用pd.read_csv()读取Excel中的数据 S&P500.csv,数据包下载地址:https://github.com/ZhangHongBo2019/Algorithms-Code
其中, pd.read_csv()的三个参数如下:
- index_col=0,把第一列当成行标签
- parse_dates=True,把行标签转成date对象
- dayFirst=True,是说日期是DD/MM/YYYY这样的格式
代码
import pandas as pd
import matplotlib.pyplot as plt

data=pd.read_csv('S&P500.csv',
                 index_col=0,
                 parse_dates=True,
                 dayfirst=True)
data.head(3).append(data.tail(3))# data.head()向你显示前3行的数据,data.tail()向你显示后3行的数据
spx=data[['Adj Close']].loc['2007-01-01':'2010-01-01']# data.loc[]基于标签的行进行选择
spx.head(3).append(spx.tail(3))
print(spx.values)
plt.plot(spx.values)
plt.show()
结果:
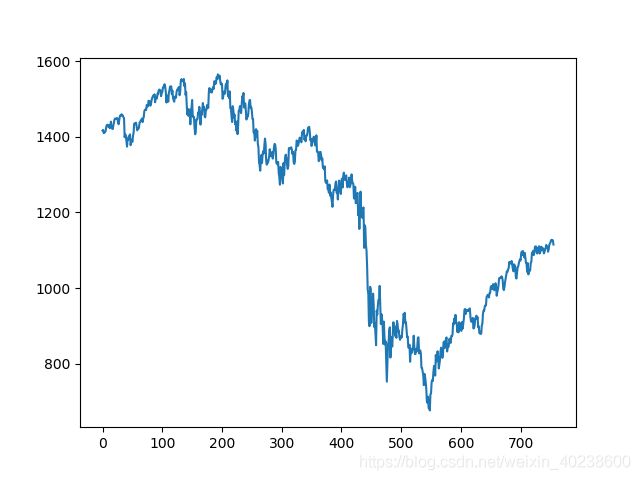
上图使用的都是matplotlib的默认设置,接下来,我们修改一下。首先我们看一下图的默认属性,
plt.rcParams

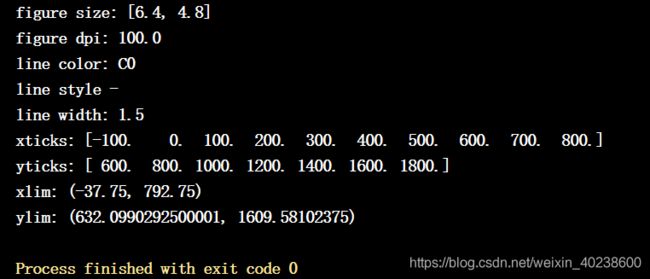
上图显示了部分属性,我们尝试在图表尺寸(figsize)、每英寸像素点(dpi)、线条颜色(color)、线条风格(linestyle)、线条宽度(linewidth)、横纵轴刻度(xticks,yticks)、横纵轴边界(xlim,ylim)。
首先观察一下这个属性的默认值,
print('figure size:', plt.rcParams['figure.figsize'])
print('figure dpi:', plt.rcParams['figure.dpi'])
print('line color:', plt.rcParams['lines.color'])
print('line style', plt.rcParams['lines.linestyle'])
print('line width:', plt.rcParams['lines.linewidth'])
fig=plt.figure()
ax=fig.add_subplot(111)
ax.plot(spx.values)
print('xticks:', ax.get_xticks())
print('yticks:', ax.get_yticks())
print('xlim:', ax.get_xlim())
print('ylim:', ax.get_ylim())
plt.figure(figsize=(6.4,4.8),dpi=100)
plt.plot(spx.values, color='C0', linewidth=1.5, linestyle='-')
plt.xticks(np.linspace(-100,800,10))
plt.yticks(np.linspace(600,1800,7))
plt.xlim(-37.75,792.75)
plt.ylim(632,1609)
plt.show()
结果和之前默认的值,效果一致:

然后,我们根据属性名,一个个的改进:
- 函数
figsize(w,h)决定图的宽和高,dpi全称:dots per inches,测量每英寸多少像素,我们将图的大小设置为16×6,dpi=100。 - 函数
plt.plot()中用color,linewidth,linestyle属性一起来控制线条的颜色、宽度、风格 - 设置下横轴和纵轴的的边界,横轴显示日期
- 设置横轴的刻度和标签,横轴的刻度间隔大,标签要显示日
- 添加图例,在
ax.plot()设置一个参数label,然后用ax.legend()
代码:
fig=plt.figure(figsize=(16,6),dpi=100)
ax=fig.add_subplot(111)
x=spx.index
y=spx.values
ax.plot(y,color='#2b4750',linewidth=2, linestyle='-',label='S&P500')
ax.legend(loc=0, frameon=True)#  loc=0 表示matplotlib会自动安排一个最好的位置显示图例,frameon=True 表示给图例加了外框
ax.set_xlim(-1, len(x)+1)
ax.set_ylim(y.min()*0.8,y.max()*1.2)
ax.set_xticks(range(0,len(x),40))
ax.set_xticklabels([x[i].strftime('%Y-%m-%d') for i in ax.get_xticks()],\
                   rotation=45)
plt.show()
结果:

进一步的,我们在原图的基础上再添加一个图,
读取数据,用pd.read_csv()函数从存好的VIX.csv读取数据
添加第二幅图,再用一次ax.plot()或plt.plot()即可,但两者在方法上不同,
-
plt.xlim() -
plt.ylim() -
plt.xticks() -
ax.set_xlim() -
ax.set_ylim() -
ax.set_xticks()
代码运行中出现了TypeError: ‘function’ object is not subscriptable,
经查阅,一般是由于没有加括号造成的,错误在:
ax.set_ylim(np.vstack([y1,y2]).min()*0.8, \np.vstack[y1,y2].max()*1.2) 后面一个np.vstack()没有加括号。
代码:
fig=plt.figure(figsize=(16,6),dpi=100)
ax=fig.add_subplot(111)
x=spx.index
y1=spx.values
y2=vix.values
ax.plot(y1,color='#2b4750',linewidth=2, linestyle='-',label='S&P500')
ax.plot(y2,color='#dc2624',linewidth=2,linestyle='-',label='VIX')
ax.legend(loc=0, frameon=True)#  loc=0 表示matplotlib会自动安排一个最好的位置显示图例,frameon=True 表示给图例加了外框
ax.set_xlim(-1, len(x)+1)
ax.set_ylim(np.vstack([y1,y2]).min()*0.8, np.vstack([y1,y2]).max()*1.2)
ax.set_xticks(range(0,len(x),40))
ax.set_xticklabels([x[i].strftime('%Y-%m-%d') for i in ax.get_xticks()],\
                   rotation=45)
plt.show()
函数np.vstack():在竖直方向上堆叠,np.hstack():在水平方向上平铺
结果:

由图形我们可以看到,由于两个数据的纵坐标相差太大,所以效果并不好,解决方法:
1、用两个坐标系
代码:
fig=plt.figure(figsize=(16,6),dpi=100)
ax1=fig.add_subplot(111)
x=spx.index
y1=spx.values
y2=vix.values
ax1.plot(y1,color='#2b4750',linewidth=2,linestyle='-',label='S&P500')
ax1.set_xlim(-1,len(x)+1)
ax1.set_ylim(np.vstack([y1,y2]).min()*0.8, np.vstack([y1,y2]).max()*1.2)
ax1.set_xticks(range(0,len(x),40))
ax1.set_xticklabels([x[i].strftime('%Y-%m-%d') for i in ax1.get_xticks()],\
                   rotation=45)
ax1.legend(loc='upper left', frameon=True)

# Add the second axes
ax2=ax1.twinx()
ax2.plot(y2,color='#dc2624',linewidth=2,linestyle='-',label='VIX')
ax2.legend(loc='upper right',frameon=True)
plt.show()
plt.figure(figsize=(16,6),dpi=100)
plt.subplot(2,1,1)
x=spx.index
y1=spx.values
plt.plot(y1,color='#2b4750',linewidth=2, linestyle='-',label='S&P500')
plt.xlim(-1, len(x)+1)
plt.ylim(y1.min()*0.8,y1.max()*1.2)
x_tick=range(0,len(x),40)
x_label=[x[i].strftime('%Y-%m-%d') for i in x_tick]
plt.xticks(x_tick,x_label,rotation=45)
plt.legend(loc='upper left', frameon=True)#  loc=0 表示matplotlib会自动安排一个最好的位置显示图例,frameon=True 表示给图例加了外框

plt.subplot(2,1,2)
y2=vix.values
plt.plot(y2,color='#dc2624',linewidth=2,linestyle='-',label='VIX')
plt.xlim(-1, len(x)+1)
plt.ylim(y2.min()*0.8, y2.max()*1.2)
plt.xticks(x_tick,x_label,rotation=45)
plt.legend(loc='upper left', frameon=True)#  loc=0 表示matplotlib会自动安排一个最好的位置显示图例,frameon=True 表示给图例加了外框
plt.tight_layout()
plt.show()
结果:
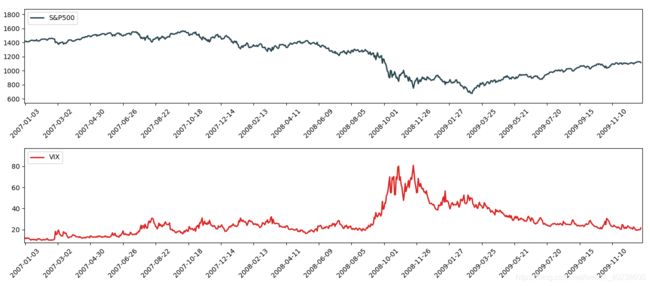
相比较而言,第一种绘图方式更妥当一些。
如果,在这些数据中,有一些特殊点(事件)需要标出来,
- 2017-10-11:牛市顶点
- 2008-03-12:贝尔斯登倒闭
- 2008-09-15:雷曼兄弟倒闭
- 2009-01-20:苏格兰皇家银行股票抛售
- 2009-04-02:G20峰会
首先,用元组列表存储特殊事件,然后对特殊事件进行标记。我们先熟悉一下相关的函数,
annotate语法说明 :annotate(s=‘str’ ,xy=(x,y) ,xytext=(l1,l2) ,…)
s——为注释文本内容
xy——为被注释的坐标
xytext——为注释文字的坐标位置
xycoords ——参数如下:
figure points ——points from the lower left of the figure 点在图左下方
figure pixels ——pixels from the lower left of the figure 图左下角的像
figure fraction ——fraction of figure from lower left 左下角数字部
axes points ——points from lower left corner of axes 从左下角点的坐标
axes pixels ——pixels from lower left corner of axes 从左下角的像素坐标
axes fraction ——fraction of axes from lower left 左下角部分
data ——use the coordinate system of the object being annotated(default) 使用的坐标系统被注释的对象(默认)
textcoords ——设置注释文字偏移量
参数 | 坐标系 |
| ‘figure points’ | 距离图形左下角的点数量 |
| ‘figure pixels’ | 距离图形左下角的像素数量 |
| ‘figure fraction’ | 0,0 是图形左下角,1,1 是右上角 |
| ‘axes points’ | 距离轴域左下角的点数量 |
| ‘axes pixels’ | 距离轴域左下角的像素数量 |
| ‘axes fraction’ | 0,0 是轴域左下角,1,1 是右上角 |
| ‘data’ | 使用轴域数据坐标系 |
arrowprops #箭头参数,参数类型为字典dict
width ——the width of the arrow in points 点箭头的宽度
headwidth ——the width of the base of the arrow head in points 在点的箭头底座的宽
headlength ——the length of the arrow head in points 点箭头的长度
shrink ——fraction of total length to ‘shrink’ from both ends 总长度为分数“缩水”从两端
facecolor ——箭头颜色
bbox给标题增加外框 ,常用参数如下:
boxstyle方框外形
facecolor(简写fc)背景颜色
edgecolor(简写ec)边框线条颜色
edgewidth边框线条大小
bbox=dict(boxstyle=‘round,pad=0.5’, fc=‘yellow’, ec=‘k’,lw=1 ,alpha=0.5) #fc为facecolor,ec为edgecolor,lw为lineweight
例子:
for xy in zip(x, y):
plt.annotate("(%s,%s)" % xy, xy=xy, xytext=(-20, 10), textcoords=‘offset points’)
text语法说明
text(x,y,string,fontsize=15,verticalalignment=“top”,horizontalalignment=“right”)
x,y——表示坐标值上的值
string——表示说明文字
fontsize——表示字体大小
verticalalignment——垂直对齐方式 ,参数:[ ‘center’ | ‘top’ | ‘bottom’ | ‘baseline’ ]
horizontalalignment——水平对齐方式 ,参数:[ ‘center’ | ‘right’ | ‘left’ ]
进一步的,为了让图形主次分明,即让S&P500成为主线,VIX成为副线,我们调整一下VIX的透明度,alpha在0-1之间,0表示完全透明,1表示完全不透明。
代码:
import pandas as pd
import matplotlib.pyplot as plt
import numpy as np
from datetime import *
data=pd.read_csv('S&P500.csv',
                 index_col=0,
                 parse_dates=True,
                 dayfirst=True)
data.head(3).append(data.tail(3))# data.head()向你显示前3行的数据,data.tail()向你显示后3行的数据
spx=data[['Adj Close']].loc['2007-01-01':'2010-01-01']# data.loc[]基于标签的行进行选择
spx.head(3).append(spx.tail(3))
data1=pd.read_csv('VIX.csv',
                 index_col=0,
                 parse_dates=True,
                 dayfirst=True)
data1.head(3).append(data1.tail(3))# data.head()向你显示前3行的数据,data.tail()向你显示后3行的数据
vix=data1[['Adj Close']].loc['2007-01-01':'2010-01-01']# data.loc[]基于标签的行进行选择
vix.head(3).append(vix.tail(3))
fig=plt.figure(figsize=(18,6), dpi=100)
crisis_data=[(datetime(2007, 10, 11), 'Peak of bull markets'),
             (datetime(2008, 3 ,12), 'Bear Stearns Fails'),
             (datetime(2009, 1, 20), 'Lehman Bankrupty'),
             (datetime(2009,4 , 2),'G20 Summit')]
ax1=fig.add_subplot(111)
x=spx.index
y1=spx.values
y2=vix.values
ax1.plot(y1, color='#2b4750', linewidth=2, linestyle='-', label='S&P500')
ax1.set_xlim(0, len(x))
#print(spx.shape[0])
ax1.set_ylim(np.vstack([y1,y2]).min()*0.8, np.vstack([y1, y2]).max()*1.2)
ax1.legend(loc='upper left', frameon=True)
ax1.set_xticks(range(0, len(x),40))
ax1.set_xticklabels([x[i].strftime('%Y-%m-%d') for i in range(0,len(x),40)], rotation=45 )
for date,label in crisis_data:
    date=date.strftime('%Y-%m-%d')
    xi=x.get_loc(date)
    yi=spx.asof(date)
    ax1.scatter(xi, yi, 80, color='#dc8018')
    ax1.annotate(label, xy=(xi, yi+40),
                 xytext=(xi,yi+300),
                 arrowprops=dict(facecolor='black', headwidth=4, width=1, headlength=6),
                 horizontalalignment='center', verticalalignment='top')

ax2=ax1.twinx()
ax2.plot(y2, color='#dc2624', linewidth=2, linestyle='-', label='VIX',,alpha=0.4)
ax2.legend(loc='upper right', frameon=True)

plt.tight_layout()
plt.show()
三、常见图形的绘制
在做图表绘制时经常面临怎么选择合适的图表,图表所展示的关系分为四大类:
我们使用图表之前,要想清楚你想表达什么样的数据关系。接下来,我们讨论一下比较常用的几种图表形式,直方图,散点图,折线图,饼状图
*数据的收集与处理
使用 YahooFinancials API来下载数据,可使用 pip install yahoofinancials,也也可使用Pycharm,按照File—>Settings——>Project interpreter,添加 yahoofinancials。
代码:
import pandas as pd
import matplotlib.pyplot as plt
import numpy as np
from datetime import *
from yahoofinancials import YahooFinancials
start_date='2018-04-29'
end_date='2019-04-29'
stock_code=['NVDA','AMZN','BABA','FB','AAPL']
currency_code=['EURUSD=X','JPY=X','CNY=X']
stock=YahooFinancials(stock_code)
currency=YahooFinancials(currency_code)
stock_daily=stock.get_historical_price_data(start_date,end_date,'daily')
currency_daily=currency.get_historical_price_data(start_date,end_date,'daily')
print(stock_daily)
def data_converter(price_data, code, asset):
    # convert raw data into datafram
    if asset=='FX':
        code=str(code[3:] if code[:3]=='USD' else  code) + '=X'

    columns=['open', 'close', 'low', 'high']
    price_dict=price_data[code]['prices']
    index=[p['formatted_date'] for p in price_dict ]
    price=[[p[c] for c in columns] for p in price_dict]
    data=pd.DataFrame(price,index=pd.Index(index,name='date'))
                          #columns=pd.Index(columns,name='OHLC'))
    return data
EURUSD=data_converter(currency_daily, 'EURUSD', 'FX')
print(EURUSD.head(3).append(EURUSD.tail(3)))
结果:

1、直方图
直方图(histogram chart),又称质量分布图,是一种统计报告图,由一系列的高等不等的纵向条纹或线段表示数据的分布情况。一般是用横轴表示数据类型,纵轴表示分布情况。在Matplotlib里的语法是
plt.hist()ax.hist()
首先看一下英伟达(NVDA)的价格分布
p_NVAD=NVDA['close']
fig=plt.figure(figsize=(8, 4))
plt.hist(p_NVAD, bins=30, color='#2b4750')
plt.xlabel('Nvidia Price')
plt.ylabel('Number of Observed')
plt.title('Frequency Distribution of Nvidia Price,Apr-2018 to Apr-2019')

plt.show()
结果:

2、散点图
散点图(scatter chart)用两组数据构成多个坐标点,考察坐标点的分布,判断两变量之间知否存在某种联系的分布模式。在Matplotlib里的语法是
plt.scatter()ax.scatter()
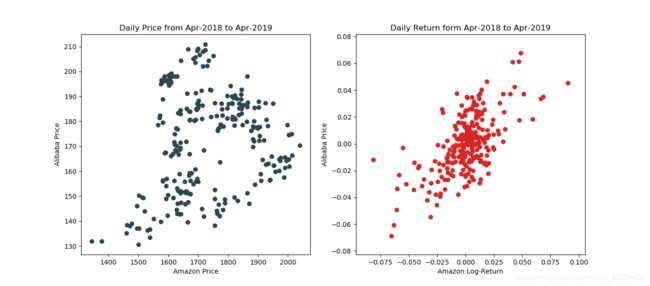
我们观察中美两大电商亚马逊(AMZN)和阿里巴巴(BABA)之间的价格和对数收益率的联系。
# 计算价格和对数收益率
AMZN=data_converter(stock_daily,'AMZN','EQ')
BABA=data_converter(stock_daily,'BABA', 'EQ')

p_AMZN=AMZN['close']
p_BABA=BABA['close']

date=p_AMZN.index
price=p_AMZN.values
r_AMZN=pd.Series(np.log(price[1:]/price[:-1]), index=date[1:])

date=p_BABA.index
price=p_BABA.values
r_BABA=pd.Series(np.log(price[1:]/price[:-1]), index=date[1:])
# 用两个子图分别展示【价格】和【收益率】
fig,axes=plt.subplots(nrows=1, ncols=2, figsize=(14, 6))
axes[0].scatter(p_AMZN,p_BABA,color='#2b4750' )
axes[0].set_xlabel('Amazon Price')
axes[0].set_ylabel('Alibaba Price')
axes[0].set_title('Daily Price from Apr-2018 to Apr-2019')

axes[1].scatter(r_AMZN, r_BABA, color='#dc2624')
axes[1].set_xlabel('Amazon Log-Return')
axes[1].set_ylabel('Alibaba Price')
axes[1].set_title('Daily Return form Apr-2018 to Apr-2019')

plt.show()
结果
3、折线图
折线图(line chart)显示随时间而变化的连续数据,因而非常适用于显示在相等时间间隔下数据的趋势。在Matplotlib里的语法是
plt.plot()ax.plot()
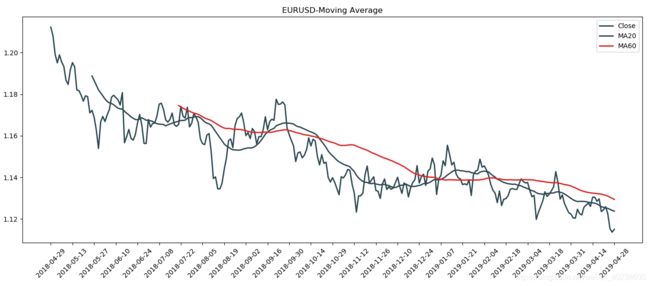
我们观察一下EURUSD的20天和60天移动平均线(Moving average, MA),适用Pandas里面的rolling(),关于这个函数的具体用法可以参考 :https://baijiahao.baidu.com/s?id=1622798772654712959&wfr=spider&for=pc
代码:
# 首先获取EURUSD的收盘价
curr='EURUSD'
EURUSD=data_converter(currency_daily, curr, 'FX')
rate=EURUSD['close']
# 用Pandas里面的rolling 函数来计算MA,在画出收盘价,MA20和MA60三条折线
fig=plt.figure(figsize=(16, 6))
ax=fig.add_subplot(111)
ax.set_title(curr + '-Moving Average')
ax.set_xticks(range(0,len(rate.index),10))
ax.set_xticklabels([rate.index[i] for i in ax.get_xticks()],rotation=45 )

ax.plot(rate, color='#2b4750',linewidth=2, label='Close')

MA_20=rate.rolling(20).mean()
MA_60=rate.rolling(60).mean()

ax.plot(MA_20, color='#2b4750', linewidth=2,label='MA20')
ax.plot(MA_60, color='#dc2624', linewidth=2, label='MA60')
ax.legend(loc=0,frameon=True)

plt.tight_layout()
plt.show()
结果:
4、饼状图
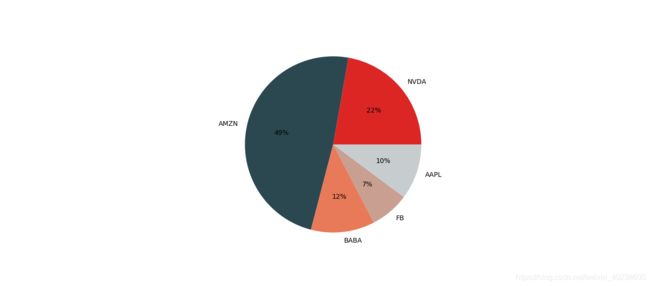
饼状huang图(pie chart)是一个划分为几个扇形的圆形统计图,用于统计描述量、频率或百分比之间的对应关系。在饼状图中,每个扇形面积大小为其所表示的数量的比例。在Matplotlib里面的语法是
-
plt.pie() -
ax.pie()
使用的数据为一个股票投资组合在2019年4月26日的市值,
代码:#首先计算五只股票在当前日期的市值
stock_list=[‘NVDA’,‘AMZN’,‘BABA’,‘FB’,‘AAPL’]
date=‘2019-04-26’
MV=[data_converter(stock_daily,code,‘EQ’)[‘close’][date] for code in stock_list]
MV=np.array(MV)np.array([100, 20, 50, 30, 40])# 价格数量=市值fig=plt.figure(figsize=(16,6))
ax=fig.add_subplot(111)
ax.pie(MV,labels=stock_list, colors=[’#dc2624’,’#2b4750’,’#e87a59’,’#C89F91’,’#c7cccf’],autopct=’%.f%%’)
plt.show()
结果:
5、柱形图
使用上面的数据,画柱形图, -
ax.bar()
代码:
fig=plt.figure(figsize=(8,6))
ax=fig.add_subplot(111)

pct_MV=MV/np.sum(MV)# 计算市值的百分数
index=np.arange(len(pct_MV))
ax.bar(index, pct_MV, facecolor='#dc2624', edgecolor='#2b4750')#index-横轴刻度,pct_MV股票组合市值比例,facecolor-柱状颜色,edgecolor-柱边颜色
ax.set_xticks(index)# 设置横轴刻度(0,1,2,3,4)和标签(stock_list)
ax.set_xticklabels(stock_list)
ax.set_ylim(0,np.max(pct_MV)*1.1)

for x,y in zip(index, pct_MV):
    ax.text(x+0.04, y+0.05/100, '{0:.0%}'.format(y), ha='center', va='bottom')

plt.show()
结果:

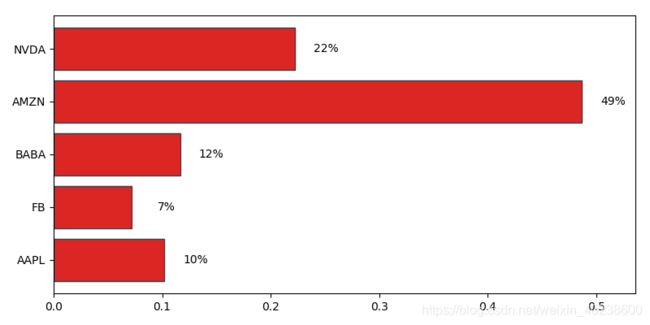
如果柱状很多,或者标签的名字很长时,我们可以shi使用横向柱状图,函数为ax.barh()
代码:
fig=plt.figure(figsize=(8,4))
ax=fig.add_subplot(111)

pet_MV=MV[::-1]/np.sum(MV)
index=np.arange(len(pet_MV))

ax.barh(index, pet_MV, facecolor='#dc2624', edgecolor='#2b4750')
ax.set_yticks(index)
ax.set_yticklabels(stock_list[::-1])
ax.set_xlim(0, np.max(pet_MV)*1.1)

for x, y in zip(pet_MV,index):# zip()的作用是把几个数组对齐,然后按列输出
    ax.text(x+0.04, y, '{0:.0%}'.format(x), ha='right',va='center')
plt.tight_layout()
plt.show()
plt.style.use('ggplot')
fig,axes=plt.subplots(nrows=1,ncols=2,figsize=(14,6))
axes[0].pie(MV,labels=stock_list,autopct='%.0f%%',startangle=90, counterclock=False)
pct_MV=MV[::-1]/np.sum(MV)
index=np.arange(len(pct_MV))
axes[1].barh(index,pct_MV)
axes[1].set_yticks(index)
axes[1].set_yticklabels(stock_list[::-1])
axes[1].set_xlim(0,np.max(pct_MV)*1.1)

for x ,y in zip(pct_MV,index):
    axes[1].text(x+0.04, y, '{:.0%}'.format(x),ha='right',va='center')#注意百分号格式的写法:{:.0%}.format()
plt.tight_layout()
plt.show()
结果:

参考资料:
1.关于pandas的进一步学习,可参考:
https://blog.csdn.net/CoderPai/article/details/83377558
2.转载微信公众号 https://mp.weixin.qq.com/s/b8IAf-liXvgn50-3HwT1VA


