毕业设计实用模型(四)——回归模型的实现(R语言)
目录
- 0引言
- 1、课本介绍
-
- 1.1理论的书
- 1.2 R语言的书
- 2、构造数据
- 3、相关性分析
- 4、多元回归模型的建立
-
- 4.1建立模型
- 5.2模型分析
- 5.3方差分析表
- 5、变量选择
-
- 5.1 逐步回归
- 5.2所有子集法
- 5.3套索法
- 6、回归模型常用函数总结
- 7、参考文献
0引言
在毕业实用模型一1、二2、三3中介绍了时间序列模型的建模思路与在R语言中的调参,今天来讲解一下回归模型的建模思路和实现。
在这里你将会学到:
- 推荐的回归模型的书籍
- 高效简介的相关性分析图
- 多元回归模型的建立
- 回归模型的诊断的阅读导读
- 有效变量的选择方法
- 回归常用的函数
1、课本介绍
本文的案例偏向R语言的实现和分析理论较少。在做回归模型之前,介绍几本做回归的书籍,其中一本是偏向理论的,大学本科的教材,有概率论数理统计基础即可看懂。一本是R语言实战的第八章,偏重讲回归模型的实现。
1.1理论的书
要想看懂本文的思路,需要一些基本的回归分析的理论,下面这本书4可以给你这些:考虑版权这里就不贴链接了。
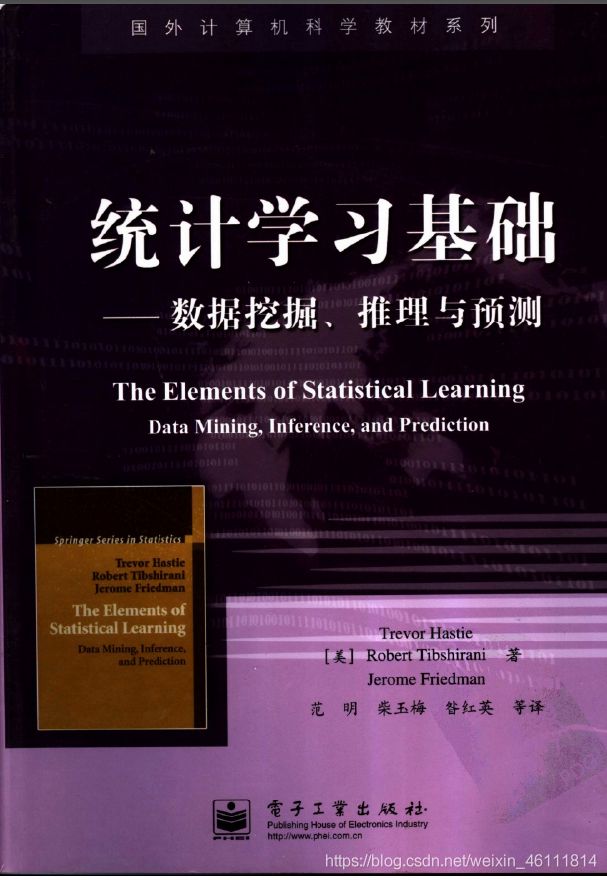
 还有一本书叫统计学习基础5,这本书是偏向理论的统计模型,介绍回归和相关的模型理论比较深一点,如果遇到的问题上面的书解决不了可以选择求助这本书,本书的三、四、七、八章是关于回归的,大家查阅学习。
1.2 R语言的书
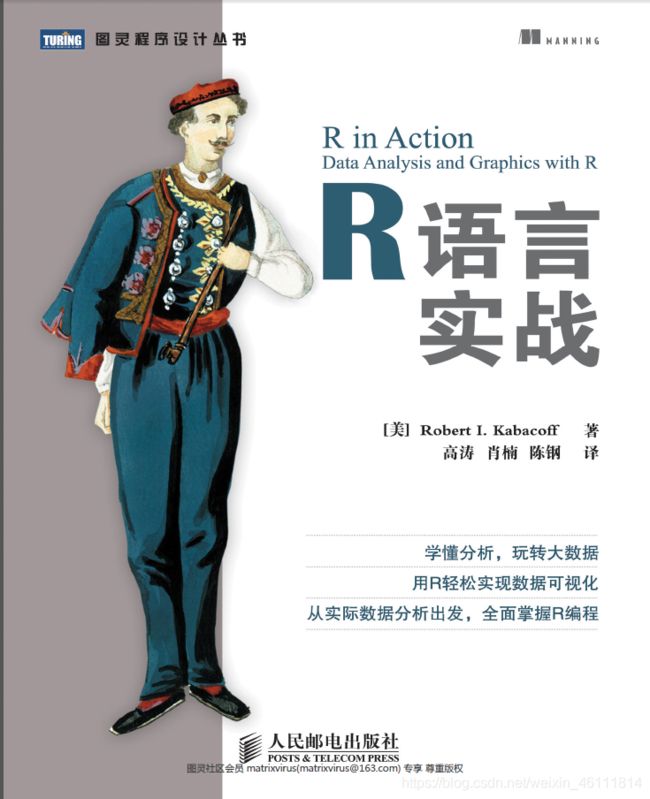
R语言实战6被很多人说成R语言的圣经,好好读完,你的R语言水平会提高一个档次。今天主要参考的是他的第八章。
展示部分目录:

2、构造数据
做回归分析需要有实际的数据,本篇使用随机模型的方式去生成规范化的数据进行建模。提前设定好真实参数,可以更好的看到模型的效果。下面是构造数据的代码:
library(MASS)  # 生成多元正态分布
> n = 300; p = 6
> Beta <- c(rep(1,3),0,0,1)  # 设置真实回归模型参数
> set.seed(0)  # 设置种子
> x = mvrnorm(n = n, mu = rep(0, p-1), Sigma = diag(rep(1, p-1)))  # 需要载入MASS包
> x6 <- x[,1] + rnorm(n, 0, 0.3)
> x = cbind(x, x6)
> colnames(x) <- paste0("x", 1:6)
> y = x %*% Beta +  + rnorm(n, 0, 2)
> Data <- data.frame(x, y = y)
> head(Data)
          x1          x2         x3         x4         x5         x6
1 -0.9593164 -0.59188422 -1.6878010 -0.1244350  1.2629543 -0.9356879
2 -1.6203166 -0.37099306  0.6476460  1.4667446 -0.3262334 -1.6357428
3  0.8225133  0.08792426  0.4487942  0.6739287  1.3297993  0.7442811
4  0.1087127 -0.03472634  1.0263022  1.9564253  1.2724293  0.5785931
5  0.7609948  1.80637427  1.0749782 -0.2690410  0.4146414  0.6493902
6 -2.3062566 -0.34023607  0.4583096 -1.2445515 -1.5399500 -1.7836732
           y
1 -4.5420488
2 -2.5045986
3  0.9620528
4  3.0366120
5  1.3610465
6 -6.2472318
介绍一下数据的生成。六个自变量。其中 x 6 x6 x6是由 x 1 x1 x1线性生成的。也就是 x 1 、 x 6 x1、x6 x1、x6具有很大的相关性。参数设置时。 x 1 、 x 2 、 x 3 、 x 6 x1、x2、x3、x6 x1、x2、x3、x6的参数是1, x 4 、 x 5 x4、x5 x4、x5的参数是0。一元回归的建立与可视化参见R语言可视化——ggplot2画回归曲线一文,里面包含了一元回归的方差分析、回归线、 R 2 R^2 R2等R语言的实现。下面讨论多元回归模型的建立。
3、相关性分析
在相关性分析时,往往需要绘制一幅比较清晰明了的相关图。下面我就对上述数据画出一部分吧相关图。
library(corrplot)  # 画相关图的包
library(customLayout) # 加载拼图包
# 创建拼图画布
lay1 <- lay_new(
  mat = matrix(1:2, ncol = 1),
  heights = c(1,1)
)
lay2 <- lay_new(
  mat = matrix(1:4, ncol = 1),
  heights = c(1,1,1,1)
)
lay3 <- lay_bind_col(lay1, lay2, widths = c(2, 1))  # 合并画布
par(mar = c(1, 1, 1, 1))
lay_show(lay3)
lay_set(lay3)
M <- cor(Data)
col1 <- colorRampPalette(c("#7F0000", "red", "#FF7F00", "yellow", "white",
                           "cyan", "#007FFF", "blue","#00007F"))
corrplot(M, method = "number", col = "black", cl.pos = "n")
corrplot(M, method = "pie", order = "AOE")
corrplot(M, method = "number")
corrplot(M, order = "AOE", addCoef.col = "grey")
corrplot(M, order = "AOE", col = col1(20), cl.length = 21, addCoef.col = "grey")
corrplot(M, method = "color", col = col1(20), cl.length = 21, order = "AOE",
         addCoef.col = "grey")
plot(Data)
下面是两幅图的效果:
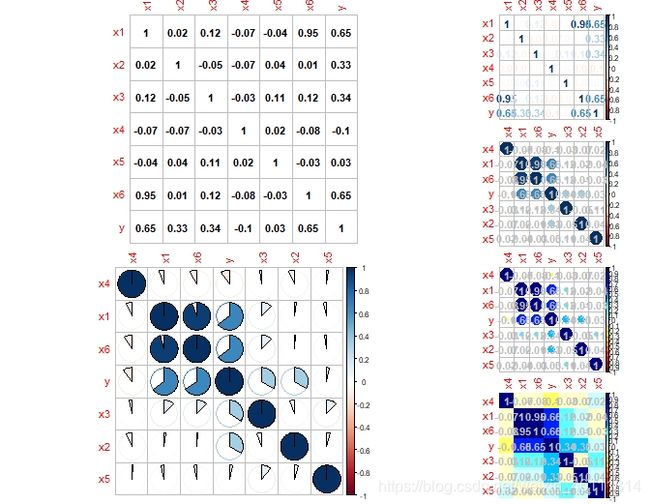
 可以在上面的相关图中按自己的需求选一幅进行分析。除此之外在建模中之前还应该:
- 对 y y y进行正态性检验。
- 对数据进行中心或者标准化,尽量各个变量之间的的差距不是很大。具体理论参考文献4第75-78页。
- n是不是远大于p,如果n不是远大于p或者数量比较接近,则可能导致过拟合、估计的参数可信度不大。
4、多元回归模型的建立
4.1建立模型
> par(mfrow = c(2, 2))
> fit <- lm(y~., data = Data)
> summary(fit)
Call:
lm(formula = y ~ ., data = Data)
Residuals:
    Min      1Q  Median      3Q     Max
-5.8223 -1.3649 -0.1257  1.5422  6.0490
Coefficients:
            Estimate Std. Error t value Pr(>|t|)
(Intercept) -0.04555    0.12520  -0.364  0.71627
x1           1.13727    0.40586   2.802  0.00541 **
x2           1.09968    0.11920   9.225  < 2e-16 ***
x3           0.99557    0.12964   7.679 2.41e-13 ***
x4          -0.08748    0.12495  -0.700  0.48442
x5           0.03488    0.13029   0.268  0.78913
x6           1.02470    0.39657   2.584  0.01025 *
---

Signif. codes:  0 ‘***’ 0.001 ‘**’ 0.01 ‘*’ 0.05 ‘.’ 0.1 ‘ ’ 1
Residual standard error: 2.159 on 293 degrees of freedom
Multiple R-squared:  0.6168,    Adjusted R-squared:  0.6089
F-statistic: 78.59 on 6 and 293 DF,  p-value: < 2.2e-16
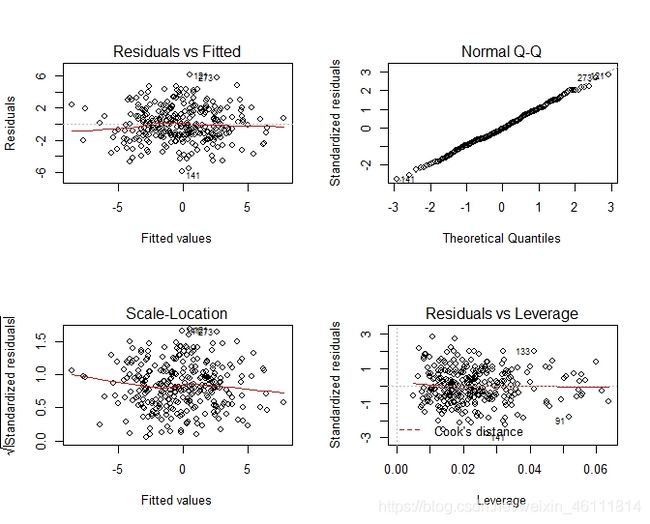
> plot(fit)
R 2 R^2 R2是0.6左右不是很显著,系数的 t t t检验中常数项 x 4 x4 x4和 x 5 x5 x5都不显著。回归方程的检验显著。还有一个模型的检验图如下。
5.2模型分析
5.3方差分析表
在R语言里是可以输出方差分析表的:
> anova(fit)
Analysis of Variance Table
下面准备剔除变量介绍一般的变量选择的方法。
Response: y
           Df  Sum Sq Mean Sq  F value    Pr(>F)
x1          1 1508.74 1508.74 323.7227 < 2.2e-16 ***
x2          1  363.08  363.08  77.9040 < 2.2e-16 ***
x3          1  290.80  290.80  62.3947 5.704e-14 ***
x4          1    3.63    3.63   0.7792   0.37812
x5          1    0.40    0.40   0.0857   0.76995
x6          1   31.12   31.12   6.6766   0.01025 *
Residuals 293 1365.55    4.66
---
Signif. codes:  0 ‘***’ 0.001 ‘**’ 0.01 ‘*’ 0.05 ‘.’ 0.1 ‘ ’ 1
5、变量选择
在多元线性回归中变量选择的方法众多,包含向前向后回归所有子集以及套索压缩系数法。本节以上面的数据模型为例演示这几种方式。
5.1 逐步回归
逐步回归的实现需要用到MASS包中的step或者stepAIC函数。
下面是step的具体参数
> step
function (object, scope, scale = 0, direction = c("both",
    "backward", "forward"), trace = 1, keep = NULL,
    steps = 1000, use.start = FALSE, k = 2, ...)
参数说明:
- object:模型的对象
- diretion:选择方法,both逐步回归,backward向前,forward向后。
代码案例:
> step(fit, direction = c("both"))  # 逐步回归
Start:  AIC=468.66
y ~ x1 + x2 + x3 + x4 + x5 + x6
       Df Sum of Sq    RSS    AIC
- x5    1      0.33 1365.9 466.73
- x4    1      2.28 1367.8 467.16
              1365.5 468.66
- x6    1     31.12 1396.7 473.42
- x1    1     36.60 1402.2 474.59
- x3    1    274.85 1640.4 521.67
- x2    1    396.64 1762.2 543.16
Step:  AIC=466.73
y ~ x1 + x2 + x3 + x4 + x6
       Df Sum of Sq    RSS    AIC
- x4    1      2.24 1368.1 465.23
              1365.9 466.73
+ x5    1      0.33 1365.5 468.66
- x6    1     31.18 1397.1 471.51
- x1    1     36.44 1402.3 472.63
- x3    1    281.26 1647.2 520.91
- x2    1    398.89 1764.8 541.60
Step:  AIC=465.23
y ~ x1 + x2 + x3 + x6
       Df Sum of Sq    RSS    AIC
              1368.1 465.23
+ x4    1      2.24 1365.9 466.73
+ x5    1      0.29 1367.8 467.16
- x6    1     32.57 1400.7 470.28
- x1    1     35.65 1403.8 470.94
- x3    1    282.58 1650.7 519.55
- x2    1    404.83 1773.0 540.99
Call:
lm(formula = y ~ x1 + x2 + x3 + x6, data = Data)
Coefficients:
(Intercept)           x1           x2           x3           x6
   -0.04082      1.12071      1.10693      1.00183      1.04557
> step(fit, direction = c("backward"))  # 向前回归
Start:  AIC=468.66
y ~ x1 + x2 + x3 + x4 + x5 + x6
       Df Sum of Sq    RSS    AIC
- x5    1      0.33 1365.9 466.73
- x4    1      2.28 1367.8 467.16
              1365.5 468.66
- x6    1     31.12 1396.7 473.42
- x1    1     36.60 1402.2 474.59
- x3    1    274.85 1640.4 521.67
- x2    1    396.64 1762.2 543.16
Step:  AIC=466.73
y ~ x1 + x2 + x3 + x4 + x6
       Df Sum of Sq    RSS    AIC
- x4    1      2.24 1368.1 465.23
              1365.9 466.73
- x6    1     31.18 1397.1 471.51
- x1    1     36.44 1402.3 472.63
- x3    1    281.26 1647.2 520.91
- x2    1    398.89 1764.8 541.60
Step:  AIC=465.23
y ~ x1 + x2 + x3 + x6
       Df Sum of Sq    RSS    AIC
              1368.1 465.23
- x6    1     32.57 1400.7 470.28
- x1    1     35.65 1403.8 470.94
- x3    1    282.58 1650.7 519.55
- x2    1    404.83 1773.0 540.99
Call:
lm(formula = y ~ x1 + x2 + x3 + x6, data = Data)
Coefficients:
(Intercept)           x1           x2           x3           x6
   -0.04082      1.12071      1.10693      1.00183      1.04557
> step(fit, direction = c("forward"))  # 向后回归
Start:  AIC=468.66
y ~ x1 + x2 + x3 + x4 + x5 + x6
Call:
lm(formula = y ~ x1 + x2 + x3 + x4 + x5 + x6, data = Data)
Coefficients:
(Intercept)           x1           x2           x3           x4
   -0.04555      1.13727      1.09968      0.99557     -0.08748
         x5           x6
    0.03488      1.02470
其中逐步回归和向前回归选择出了重要的变量,而且估计的参数效果比较好。向后回归没有选择出好的变量。当然不是说向后回归选择变量不好,可能换个数据向前回归也会失效。下面介绍所有子集法,从所有可能的自变量的集合中选出最优的模型,缺点是计算量比较大。这里变量只有6个,所有我们使用相关函数进行计算。
5.2所有子集法
实现所有子集所用的包是leaps,打开下面的函数参数需要用到泛型函数的知识,具体参见泛型函数的讲解和案例7。
plot(x, labels=obj$xnames, main=NULL, scale=c("bic", "Cp", "adjr2", "r2"),
col=gray(seq(0, 0.9, length = 10)),...)
- scale这个参数是调整模型的选择顺序。例子如下:
leap <- regsubsets(y~.,data = Data)
class(leap)
par(mfrow = c(2,2))
plot(leap,scale="bic")
plot(leap,scale="Cp")
plot(leap,scale="adjr2")
plot(leap,scale="r2")
?plot.regsubsets
 可以看出 b i c 、 c p 、 a d j r 2 bic、cp、adjr2 bic、cp、adjr2三个标准可以选择出好的模型。r2的第二个模型是最优的。
5.3套索法
这个方法不同于上述两种方式,是文献5的作者首次在1996年提出的。在文献二第三章的第四节中有此方法的具体介绍。本节使用ncvreg包来对上述模型实现变量选择。
先介绍ncvreg和cv.ncvreg这两个函数。
> ncvreg
function (X, y, family = c("gaussian", "binomial",
    "poisson"), penalty = c("MCP", "SCAD",
    "lasso"), gamma = switch(penalty, SCAD = 3.7, 3), alpha = 1,
    lambda.min = ifelse(n > p, 0.001, 0.05), nlambda = 100, lambda,
    eps = 1e-04, max.iter = 10000, convex = TRUE, dfmax = p +
        1, penalty.factor = rep(1, ncol(X)), warn = TRUE, returnX,
    ...)
 > cv.ncvreg
 function (X, y, ..., cluster, nfolds = 10, seed, fold, returnY = FALSE,
 trace = FALSE)
- X因变量矩阵
- 响应变量向量
- family 广义线性模型的分布族这里用高斯即可。
- penalty惩罚函数这里用MCP和lasso即可。
案例:
> X <- as.matrix(Data[,1:6])
> Y <- Data[,7]
> fit1 <- cv.ncvreg(X,Y,penalty = "MCP", trace = T)
Starting CV fold #1
Starting CV fold #2
Starting CV fold #3
Starting CV fold #4
Starting CV fold #5
Starting CV fold #6
Starting CV fold #7
Starting CV fold #8
Starting CV fold #9
Starting CV fold #10
> coef(fit1)
(Intercept)          x1          x2          x3          x4          x5
-0.04211208  1.12333734  1.10523022  1.00117800 -0.02642666  0.00000000
         x6
 1.04100244
> summary(fit1)
MCP-penalized linear regression with n=300, p=6
At minimum cross-validation error (lambda=0.0685):
-------------------------------------------------
  Nonzero coefficients: 5
  Cross-validation error (deviance): 4.81
  R-squared: 0.60
  Signal-to-noise ratio: 1.47
  Scale estimate (sigma): 2.192
> fit2 <- ncvreg(X,Y,penalty = "lasso")
> fit3 <- ncvreg(X, Y, penalty = "lasso", lambda = 0.2)
> coef(fit3)
(Intercept)          x1          x2          x3          x4          x5
-0.06064812  1.03875142  0.90957439  0.80761377  0.00000000  0.00000000
         x6
 0.94863056
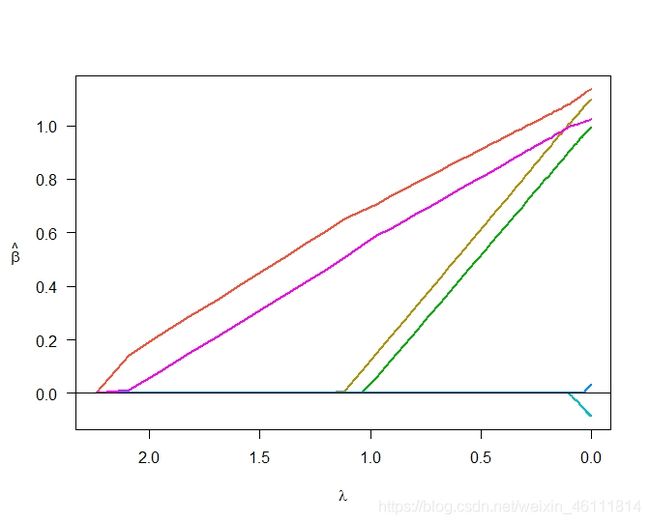
plot(fit1)
plot(fit2)
6、回归模型常用函数总结
这篇知识讲了回归模型的基本一些方法除此之外你还可能会用到回归诊断和异常值的改进,最后列举一写常用的函数。
| 函数 | 功能 | 所在R包 | 所在课本页码 |
|---|---|---|---|
| confint | 输出模型预测的置信区间 | 基础包 | (R实战第一版171) |
| qqPlot | 正态检验 | car包 | (R实战第一版175) |
| durbinWatsonTest | 对误差自相关性 | car包 | (R实战第一版175) |
| crPlots | 成分与残差图:检验模型的线性 | car包 | (R实战第一版175) |
| outlierTest | Bonferroni离群点检验 | car包 | (R实战第一版175) |
| vif | 对误差自相关性 | car包 | (R实战第一版175) |
| ressidplot | 残差图 | 自编函数 | (R实战第一版177) |
| durbinWatsonTest | 方差膨胀因子 | car包 | (R实战第一版177) |
| fitted | 列出拟合模型的预测值 | 基础包 | R实战第一版162页 |
| residuals | 列出拟合模型的残差值 | 基础包 | R实战第一版162页 |
| vcov | 列出模型参数的协方差矩阵 | 基础包 | R实战第一版162页 |
| AIC | 输出赤池信息统计量 | 基础包 | R实战第一版162页 |
| plot | 生成评价拟合模型的诊断图 | 基础包 | R实战第一版162页 |
| predict | 用拟合模型对新的数据集预测响应变量值 | 基础包 | R实战第一版162页 |
7、参考文献
https://blog.csdn.net/weixin_46111814/article/details/105348265 ↩︎
https://blog.csdn.net/weixin_46111814/article/details/105370507 ↩︎
https://blog.csdn.net/weixin_46111814/article/details/105583080 ↩︎ ↩︎
何晓群 应用回归分析第四版 ↩︎ ↩︎
统计学习基础 ↩︎ ↩︎
R语言实战 ↩︎
https://blog.csdn.net/weixin_46111814/article/details/105624660 ↩︎
