关于天池二手车预测的数据的特征工程
赛题:零基础入门数据挖掘 - 二手车交易价格预测
地址:https://tianchi.aliyun.com/competition/entrance/231784/introduction?spm=5176.12281957.1004.1.38b02448ausjSX
**在进行数据挖掘的时候,其实我们现在开源的算法大多都差不多,准确率没有多大区别,最终影响结果的在我看来一个是对数据的处理,一个是对模型的选择,而数据的处理在专业疏于离叫做特征工程。
而在我看来,常见的特征工程处理内容如下:
1:异常值处理
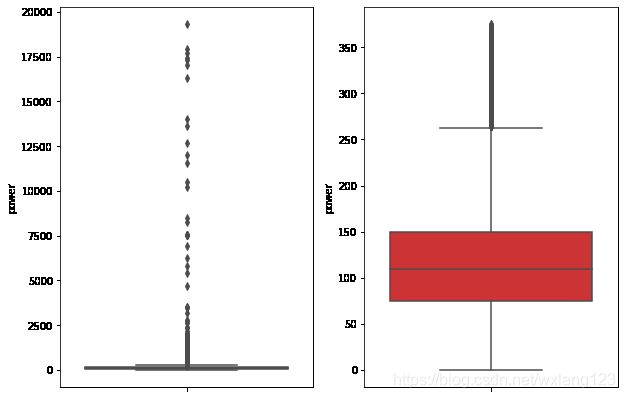
通过画箱型图来选择,然后删除
2:缺失值处理
删除,补全,不处理
3:归一化
对于连续数据或者范围过大的数据进行归一,减少数据对模型的扰动性
4:特征选择
选择比较合适的特征来进行模型的训练
一:数据初步浏览
import pandas as pd
import numpy as np
import matplotlib
import matplotlib.pyplot as plt
import seaborn as sns
from operator import itemgetter

%matplotlib inline

path = './data/'
Train_data = pd.read_csv(path+'used_car_train_20200313.csv', sep=' ')
Test_data = pd.read_csv(path+'used_car_testA_20200313.csv', sep=' ')
print(Train_data.shape)
print(Test_data.shape)
(150000, 31)
(50000, 30)
Train_data.head()
Train_data.columns
Test_data.columns
Index([‘SaleID’, ‘name’, ‘regDate’, ‘model’, ‘brand’, ‘bodyType’, ‘fuelType’,
‘gearbox’, ‘power’, ‘kilometer’, ‘notRepairedDamage’, ‘regionCode’,
‘seller’, ‘offerType’, ‘creatDate’, ‘v_0’, ‘v_1’, ‘v_2’, ‘v_3’, ‘v_4’,
‘v_5’, ‘v_6’, ‘v_7’, ‘v_8’, ‘v_9’, ‘v_10’, ‘v_11’, ‘v_12’, ‘v_13’,
‘v_14’],
dtype=‘object’)
二:数据异常值处理
def outliers_proc(data, col_name, scale=3):


    def box_plot_outliers(data_ser, box_scale):
        """
        利用箱线图去除异常值
        :param data_ser: 接收 pandas.Series 数据格式
        :param box_scale: 箱线图尺度,
        :return:
        """
        iqr = box_scale * (data_ser.quantile(0.75) - data_ser.quantile(0.25))
        val_low = data_ser.quantile(0.25) - iqr
        val_up = data_ser.quantile(0.75) + iqr
        rule_low = (data_ser < val_low)
        rule_up = (data_ser > val_up)
        return (rule_low, rule_up), (val_low, val_up)

    data_n = data.copy()
    data_series = data_n[col_name]
    rule, value = box_plot_outliers(data_series, box_scale=scale)
    index = np.arange(data_series.shape[0])[rule[0] | rule[1]]
    print("Delete number is: {}".format(len(index)))
    data_n = data_n.drop(index)
    data_n.reset_index(drop=True, inplace=True)
    print("Now column number is: {}".format(data_n.shape[0]))
    index_low = np.arange(data_series.shape[0])[rule[0]]
    outliers = data_series.iloc[index_low]
    print("Description of data less than the lower bound is:")
    print(pd.Series(outliers).describe())
    index_up = np.arange(data_series.shape[0])[rule[1]]
    outliers = data_series.iloc[index_up]
    print("Description of data larger than the upper bound is:")
    print(pd.Series(outliers).describe())

    fig, ax = plt.subplots(1, 2, figsize=(10, 7))
    sns.boxplot(y=data[col_name], data=data, palette="Set1", ax=ax[0])
    sns.boxplot(y=data_n[col_name], data=data_n, palette="Set1", ax=ax[1])
    return data_n
Train_data = outliers_proc(Train_data, 'power', scale=3)
Delete number is: 963
Now column number is: 149037
Description of data less than the lower bound is:
count 0.0
mean NaN
std NaN
min NaN
25% NaN
50% NaN
75% NaN
max NaN
Name: power, dtype: float64
Description of data larger than the upper bound is:
count 963.000000
mean 846.836968
std 1929.418081
min 376.000000
25% 400.000000
50% 436.000000
75% 514.000000
max 19312.000000
Name: power, dtype: float64

这是针对一个特征的处理,针对其他的特征也可以类似处理
三:数据联合及其他相关数据挖掘处理
Train_data['train']=1
Test_data['train']=0
data = pd.concat([Train_data, Test_data], ignore_index=True)
print(data)
SaleID name regDate model brand bodyType fuelType gearbox \
0 0 736 20040402 30.0 6 1.0 0.0 0.0
1 1 2262 20030301 40.0 1 2.0 0.0 0.0
2 2 14874 20040403 115.0 15 1.0 0.0 0.0
3 3 71865 19960908 109.0 10 0.0 0.0 1.0
4 4 111080 20120103 110.0 5 1.0 0.0 0.0
… … … … … … … … …
199032 199995 20903 19960503 4.0 4 4.0 0.0 0.0
199033 199996 708 19991011 0.0 0 0.0 0.0 0.0
199034 199997 6693 20040412 49.0 1 0.0 1.0 1.0
199035 199998 96900 20020008 27.0 1 0.0 0.0 1.0
199036 199999 193384 20041109 166.0 6 1.0 NaN 1.0
power kilometer ... v_6 v_7 v_8 v_9 \
0 60 12.5 … 0.101988 0.129549 0.022816 0.097462
1 0 15.0 … 0.121004 0.135731 0.026597 0.020582
2 163 12.5 … 0.114912 0.165147 0.062173 0.027075
3 193 15.0 … 0.110300 0.121964 0.033395 0.000000
4 68 5.0 … 0.073205 0.091880 0.078819 0.121534
… … … … … … … …
199032 116 15.0 … 0.130044 0.049833 0.028807 0.004616
199033 75 15.0 … 0.108095 0.066039 0.025468 0.025971
199034 224 15.0 … 0.105724 0.117652 0.057479 0.015669
199035 334 15.0 … 0.000490 0.137366 0.086216 0.051383
199036 68 9.0 … 0.000300 0.103534 0.080625 0.124264
v_10 v_11 v_12 v_13 v_14 train
0 -2.881803 2.804097 -2.420821 0.795292 0.914762 1
1 -4.900482 2.096338 -1.030483 -1.722674 0.245522 1
2 -4.846749 1.803559 1.565330 -0.832687 -0.229963 1
3 -4.509599 1.285940 -0.501868 -2.438353 -0.478699 1
4 -1.896240 0.910783 0.931110 2.834518 1.923482 1
… … … … … … …
199032 -5.978511 1.303174 -1.207191 -1.981240 -0.357695 0
199033 -3.913825 1.759524 -2.075658 -1.154847 0.169073 0
199034 -4.639065 0.654713 1.137756 -1.390531 0.254420 0
199035 1.833504 -2.828687 2.465630 -0.911682 -2.057353 0
199036 2.914571 -1.135270 0.547628 2.094057 -1.552150 0
[199037 rows x 32 columns]
# 这个是计算汽车的使用时间,因为这是一个没有直接给到的变量,但是又是个非常重要的变量,汽车的价格和它的使用时间成反向关系
data['used_time'] = (pd.to_datetime(data['creatDate'], format='%Y%m%d', errors='coerce') -
                            pd.to_datetime(data['regDate'], format='%Y%m%d', errors='coerce')).dt.days
# 有些特征的值是空的,所以看看是否有必要删除,看其所占比例
# 使用时间为空的比例占了整个样本的比例7.5%左右,所以还是不删除了吧,等后期可以填充
data['used_time'].isnull().sum()
15072
# 从邮编中提取城市信息,这是因为地域也是影响价格的因素之一,城市级别不一样,价格不一样
data['city'] = data['regionCode'].apply(lambda x : str(x)[:-3])
data = data
# 计算某品牌的销售统计量,对其他的特征也可以进行类似的操作
# 这里要以 train 的数据计算统计量
Train_gb = Train_data.groupby("brand")
all_info = {
     }
for kind, kind_data in Train_gb:
    info = {
     }
    kind_data = kind_data[kind_data['price'] > 0]
    info['brand_amount'] = len(kind_data)
    info['brand_price_max'] = kind_data.price.max()
    info['brand_price_median'] = kind_data.price.median()
    info['brand_price_min'] = kind_data.price.min()
    info['brand_price_sum'] = kind_data.price.sum()
    info['brand_price_std'] = kind_data.price.std()
    info['brand_price_average'] = round(kind_data.price.sum() / (len(kind_data) + 1), 2)
    all_info[kind] = info
brand_fe = pd.DataFrame(all_info).T.reset_index().rename(columns={
     "index": "brand"})
data = data.merge(brand_fe, how='left', on='brand')
四:数据离散化
# 对数据进行分桶,根据我的认知来说,进行分桶后可以把一系列的连续数据转化成离散数据,有助于后期
# 模型的数据输入,不至于对模型造成很大的干扰,就拿年龄这个值来说,可能50岁和100岁如果当成是值输进去肯定会有很大的差别,
# 但是如果把他们转换成离散值则结果就不会有很明显的差别
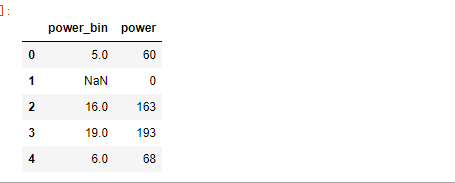
bin = [i*10 for i in range(31)]
data['power_bin'] = pd.cut(data['power'], bin, labels=False)
data[['power_bin', 'power']].head()
# 删除不需要的数据
data = data.drop(['creatDate', 'regDate', 'regionCode'], axis=1)
print(data.shape)
data.columns
Index([‘SaleID’, ‘name’, ‘model’, ‘brand’, ‘bodyType’, ‘fuelType’, ‘gearbox’,
‘power’, ‘kilometer’, ‘notRepairedDamage’, ‘seller’, ‘offerType’,
‘price’, ‘v_0’, ‘v_1’, ‘v_2’, ‘v_3’, ‘v_4’, ‘v_5’, ‘v_6’, ‘v_7’, ‘v_8’,
‘v_9’, ‘v_10’, ‘v_11’, ‘v_12’, ‘v_13’, ‘v_14’, ‘train’, ‘used_time’,
‘city’, ‘brand_amount’, ‘brand_price_max’, ‘brand_price_median’,
‘brand_price_min’, ‘brand_price_sum’, ‘brand_price_std’,
‘brand_price_average’, ‘power_bin’],
dtype=‘object’)
# 目前的数据其实已经可以给树模型使用了,所以我们导出一下
data.to_csv('data_for_tree.csv', index=0)、
# 我们可以在构造一份数据给LR,NN模型使用
# 之所以分开构造不同的训练数据是因为不同的模型对数据的要求不一样
# 看一下数据的分布
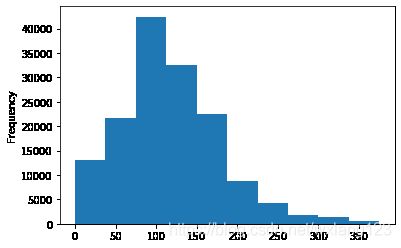
data['power'].plot.hist()
# 很明显上述的某个特征值分布不够均匀,所以我们就要用
# 一些手段让他们分布均匀,我们对其取 log,在做归一化
# 我们刚刚已经对 train 进行异常值处理了,但是现在还有这么奇怪的分布是因为 test 中的 power 异常值,
# 所以我们其实刚刚 train 中的 power 异常值不删为好,可以用长尾分布截断来代替
Train_data['power'].plot.hist()
from sklearn import preprocessing
min_max_scaler = preprocessing.MinMaxScaler()
data['power'] = np.log(data['power'] + 1)
data['power'] = ((data['power'] - np.min(data['power'])) / (np.max(data['power']) - np.min(data['power'])))
data['power'].plot.hist()
# 除此之外 还有我们刚刚构造的统计量特征:
# 'brand_amount', 'brand_price_average', 'brand_price_max',
# 'brand_price_median'等,我们都要进行归一化处理
# 这里不再一一举例分析了,直接做变换,
def max_min(x):
    return (x - np.min(x)) / (np.max(x) - np.min(x))
data['brand_amount'] = max_min(data['brand_amount'])
data['brand_price_average'] = max_min(data['brand_price_average'])
data['brand_price_max'] = max_min(data['brand_price_max'])
data['brand_price_median'] = max_min(data['brand_price_median'])
data['brand_price_min'] = max_min(data['brand_price_min'])
data['brand_price_std'] = max_min(data['brand_price_std'])
data['brand_price_sum'] = max_min(data['brand_price_sum'])
# 其次,我们还要对类别特征进行oneHotEncoder
data = pd.get_dummies(data, columns=['model', 'brand', 'bodyType', 'fuelType',
                                     'gearbox', 'notRepairedDamage', 'power_bin'])
print(data.shape)
data.columns
(199037, 370)
Index([‘SaleID’, ‘name’, ‘power’, ‘kilometer’, ‘seller’, ‘offerType’, ‘price’,
‘v_0’, ‘v_1’, ‘v_2’,
…
‘power_bin_20.0’, ‘power_bin_21.0’, ‘power_bin_22.0’, ‘power_bin_23.0’,
‘power_bin_24.0’, ‘power_bin_25.0’, ‘power_bin_26.0’, ‘power_bin_27.0’,
‘power_bin_28.0’, ‘power_bin_29.0’],
dtype=‘object’, length=370)
# 这份数据可以给lr用,导出
data.to_csv('data_for_lr.csv', index=0)
五:特征选择
5.1 过滤式
# 相关性分析
print(data['power'].corr(data['price'], method='spearman'))
print(data['kilometer'].corr(data['price'], method='spearman'))
print(data['brand_amount'].corr(data['price'], method='spearman'))
print(data['brand_price_average'].corr(data['price'], method='spearman'))
print(data['brand_price_max'].corr(data['price'], method='spearman'))
print(data['brand_price_median'].corr(data['price'], method='spearman'))
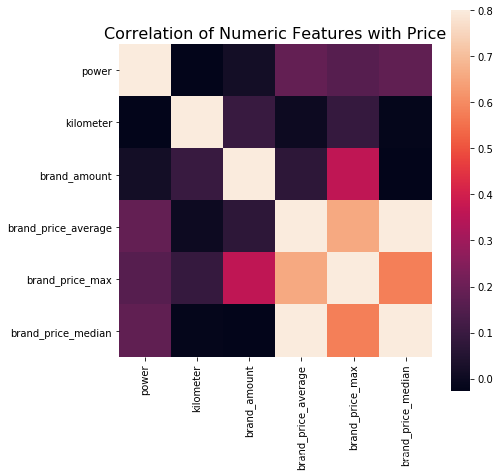
# 不过也可以直接看图,看应该选择哪些特征
data_numeric = data[['power', 'kilometer', 'brand_amount', 'brand_price_average',
                     'brand_price_max', 'brand_price_median']]
correlation = data_numeric.corr()

f , ax = plt.subplots(figsize = (7, 7))
plt.title('Correlation of Numeric Features with Price',y=1,size=16)
sns.heatmap(correlation,square = True,  vmax=0.8)
from mlxtend.feature_selection import SequentialFeatureSelector as SFS
from sklearn.linear_model import LinearRegression
sfs = SFS(LinearRegression(),
           k_features=10,
           forward=True,
           floating=False,
           scoring = 'r2',
           cv = 0)
x = data.drop(['price'], axis=1)
x = x.fillna(0)
y = data['price']
sfs.fit(x, y)
sfs.k_feature_names_
# 画出来,可以看到边际效益
from mlxtend.plotting import plot_sequential_feature_selection as plot_sfs
import matplotlib.pyplot as plt
fig1 = plot_sfs(sfs.get_metric_dict(), kind='std_dev')
plt.grid()
plt.show()


