python绘制柱状图,如何改变柱状柱间距,如何设置横纵轴标签(绘制Intel Realsense D435深度误差柱状图)
文章目录
-
- [参考文章1:Python 绘制 柱状图](https://www.cnblogs.com/shenxiaolin/p/11100094.html)
- 我的代码
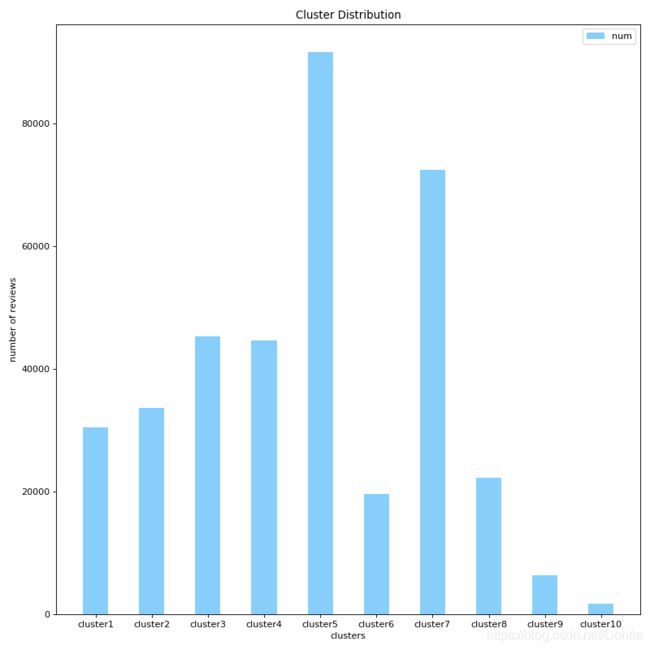
参考文章1:Python 绘制 柱状图
# 创建一个点数为 8 x 6 的窗口, 并设置分辨率为 80像素/每英寸
plt.figure(figsize=(10, 10), dpi=80)
# 再创建一个规格为 1 x 1 的子图
# plt.subplot(1, 1, 1)
# 柱子总数
N = 10
# 包含每个柱子对应值的序列
values = (56796,42996,24872,13849,8609,5331,1971,554,169,26)
# 包含每个柱子下标的序列
index = np.arange(N)
# 柱子的宽度
width = 0.45
# 绘制柱状图, 每根柱子的颜色为紫罗兰色
p2 = plt.bar(index, values, width, label="num", color="#87CEFA")
# 设置横轴标签
plt.xlabel('clusters')
# 设置纵轴标签
plt.ylabel('number of reviews')
# 添加标题
plt.title('Cluster Distribution')
# 添加纵横轴的刻度
plt.xticks(index, ('mentioned1cluster', 'mentioned2cluster', 'mentioned3cluster', 'mentioned4cluster', 'mentioned5cluster', 'mentioned6cluster', 'mentioned7cluster', 'mentioned8cluster', 'mentioned9cluster', 'mentioned10cluster'))
# plt.yticks(np.arange(0, 10000, 10))
# 添加图例
plt.legend(loc="upper right")
plt.show()
我的代码
# -*- coding: utf-8 -*-
"""
@File : 测试拟合平面.py
@Time : 2020/9/8 9:23
@Author : Dontla
@Email : [email protected]
@Software: PyCharm
"""
import numpy as np
import matplotlib.pyplot as plt
from mpl_toolkits.mplot3d import Axes3D
from numba import jit
# 加载数据
def load_data(file_path):
# 读取数据
npzfile = np.load(file_path)
# x, y, z = npzfile['arr_0'], npzfile['arr_1'], npzfile['arr_2']
return npzfile['x'], npzfile['y'], npzfile['z']
# 计算拟合片面
def cal_flat(x_, y_, z_):
# 取样点数量
point_num = len(x_)
print('len={}'.format(point_num))
# 创建系数矩阵A
a = 0
A = np.ones((point_num, 3))
for i in range(0, point_num):
A[i, 0] = x_[a]
A[i, 1] = y_[a]
a = a + 1
# print(A)
# 创建矩阵b
b = np.zeros((point_num, 1))
a = 0
for i in range(0, point_num):
b[i, 0] = z_[a]
a = a + 1
# print(b)
# 通过X=(AT*A)-1*AT*b直接求解
A_T = A.T
A1 = np.dot(A_T, A)
A2 = np.linalg.inv(A1)
A3 = np.dot(A2, A_T)
X = np.dot(A3, b)
print('平面拟合结果为:z = %.6f * x + %.6f * y + %.6f' % (X[0, 0], X[1, 0], X[2, 0]))
# 计算方差
R = 0
for i in range(0, point_num):
R = R + (X[0, 0] * x_[i] + X[1, 0] * y_[i] + X[2, 0] - z_[i]) ** 2
print('方差为:%.*f' % (3, R))
return X
# 绘制三维深度散点图及拟合平面
def show_flat(X):
# 展示图像
fig1 = plt.figure()
ax1 = fig1.add_subplot(111, projection='3d')
ax1.set_xlabel("x")
ax1.set_ylabel("y")
ax1.set_zlabel("z")
# ax1.scatter(x, y, z, c='r', marker='o')
ax1.scatter(x, y, z, c='r', marker='.')
x_p = np.linspace(-200, 1480, 168)
y_p = np.linspace(-200, 920, 112)
x_p, y_p = np.meshgrid(x_p, y_p)
z_p = X[0, 0] * x_p + X[1, 0] * y_p + X[2, 0]
ax1.plot_wireframe(x_p, y_p, z_p, rstride=10, cstride=10)
plt.show()
# 计算深度误差
def cal_error_distribution(x_, y_, z_, coefficient_):
# 计算误差
error = z_ - (coefficient_[0, 0] * x_ + coefficient_[1, 0] * y_ + coefficient_[2, 0])
return error
# 统计各个区间误差的数量
def count_error_number(depth_error_, column_num):
# 提取负向最大深度误差和正向最大深度误差
error_max = np.max(depth_error)
# print(error_max) # 23.39967553034205
error_min = np.min(depth_error)
# print(error_min) # -18.65760653439031
# 柱子宽度
error_width = (error_max - error_min) / column_num
# print(column_width) # 1.6822912825892944
# 创建柱子高度序列
column_height_sequence = np.zeros(column_num)
# 统计每个柱子包含深度点的数量
for error in depth_error_:
index = int((error - error_min) // error_width)
# 当深度误差error等于最大深度误差的时候,下标会溢出,所以要加个判断限制一下
if index == column_num:
# print(dep) # 23.39967553034205
index -= 1
column_height_sequence[index] += 1
# print(column_height_sequence)
return column_height_sequence
# 绘制柱状图
def draw_histogram(column_height_sequence_):
# 创建一个点数为 8 x 6 的窗口, 并设置分辨率为 80像素/每英寸
plt.figure(figsize=(10, 10), dpi=80)
# plt.figure()
# 再创建一个规格为 1 x 1 的子图
# plt.subplot(1, 1, 1)
# 柱子总数
N = len(column_height_sequence)
# 包含每个柱子对应值的序列
values = column_height_sequence_
# 包含每个柱子下标的序列
index = np.arange(N)
# 柱子的宽度
width = 1
# 绘制柱状图, 每根柱子的颜色为紫罗兰色
# p2 = plt.bar(index, values, width, label="num", color="#87CEFA")
p2 = plt.bar(index, values, width, label="num", color="#87CEFA")
# 设置横轴标签
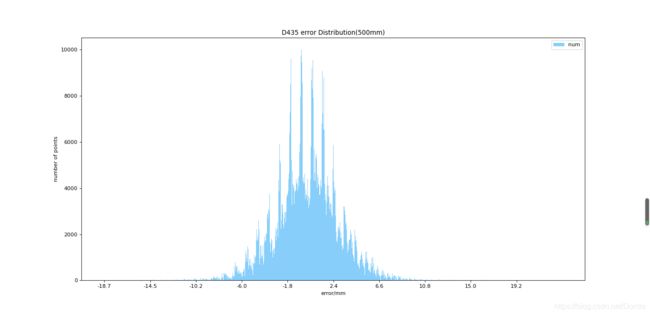
plt.xlabel('error/mm')
# 设置纵轴标签
plt.ylabel('number of points')
# 添加标题
plt.title('D435 error Distribution(500mm)')
# 添加纵横轴的刻度
index_new = []
for index_ in index:
if index_ % 100 == 0:
index_new.append(index_)
# print(index_new)
index_new_content = []
for index in index_new:
error_max = np.max(depth_error)
error_min = np.min(depth_error)
index_new_content.append(error_min + (error_max - error_min) * index / N)
index_new_content_string = [str(i) for i in np.around(index_new_content, decimals=1)]
# plt.xticks(index, (
# 'mentioned1cluster', 'mentioned2cluster', 'mentioned3cluster', 'mentioned4cluster', 'mentioned5cluster',
# 'mentioned6cluster', 'mentioned7cluster', 'mentioned8cluster', 'mentioned9cluster', 'mentioned10cluster'))
plt.xticks(index_new, index_new_content_string)
# plt.yticks(np.arange(0, 10000, 10))
# 添加图例
plt.legend(loc="upper right")
plt.show()
if __name__ == '__main__':
# 加载数据
x, y, z = load_data('./data/500mm/4_1599623292.4111953.npz')
# 拟合平面并返回平面函数系数
coefficient = cal_flat(x, y, z)
# 绘制平面及深度散点
# show_flat(coefficient)
# 计算深度误差
depth_error = cal_error_distribution(x, y, z, coefficient)
# 统计各个误差区间的数量(柱状图各个柱子高度)
column_height_sequence = count_error_number(depth_error, 1000)
# 绘制柱状图
draw_histogram(column_height_sequence)
代码中深度数据:
https://download.csdn.net/download/Dontla/12833241