R语言面积图 area chart
简介
面积图展现了数值型变量随着另外一个变量变化的趋势。一般都是变量随时间的变化。面积图其实就是折线图,只是在线和X轴之间填满了颜色。面积图一般分为两种:
- 重叠面积图,显示各个数值随时间或类别变化的趋势。每一个数值分别显示。有的时候数值会被隐藏起来。
- 堆积面积图,各个数值堆积在一起显示总量。主要是part-to-whole的概念。不单单可以看出总量,而且可以看出每一个数值的对比和对总量的贡献。
- 百分比堆积面积图,是堆积图的变化。不显示各个数值,显示各个数值在总量中所占的百分比。
geom_area
R base包里面没有对面积图的支持。在ggplot2里面,geom_area是用来生成面积图的。
geom_area(mapping = NULL, data = NULL, stat = "identity",
 position = "stack", na.rm = FALSE, show.legend = NA,
 inherit.aes = TRUE, ...)
重叠面积图 overlapping area chart
数据是一个北方城市2019年一月份和2020年一月份的温度。我们用面积图看一下两年的高温趋势和差异。
处理数据的code:
newData2019<-data.frame(c(1:31),tempData2019[,2])
names(newData2019) <- c("date","high")
newData2020<-data.frame(c(1:31),tempData2020[,2])
names(newData2020) <- c("date","high")
newData <- rbind(newData2019, newData2020)
year<- vector(length=62, mode="integer")
year[1:31] <- 2019
year[31:62] <- 2020
newData <- cbind(newData,year)
newData$year <- as.factor(newData$year)

> head(newData)
  date high year
1    1    4 2019
2    2    3 2019
3    3    2 2019
4    4    1 2019
5    5    5 2019
6    6    3 2019
geom_area默认是堆积面积图,所有我们需要将position设置成position_dodge()绘制重叠面积图。
ggplot(newData, aes(x=date,y=high,fill=year))  +
  geom_area(position = position_dodge())
geom_area设置透明度
重叠面积图会使一部分数值隐藏起来,我们可以设置透明度来解决这个问题。
ggplot2里面用alpha设置。
ggplot(newData, aes(x=date,y=high,fill=year))  +
  geom_area(position = position_dodge(),  alpha = 0.5)
堆积面积图 stacked area chart
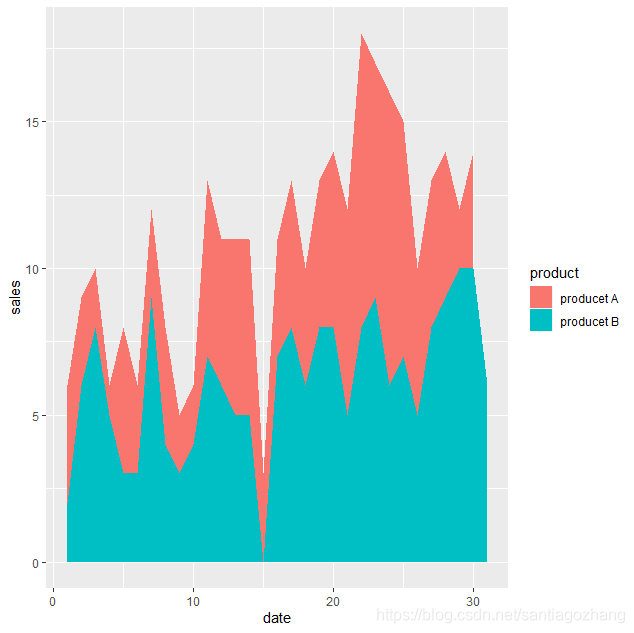
基于上面的数据,我们用默认的geom_area参数,画出来的就是堆积面积图。堆积面积图一般表示的是分组和总量的关系。两个温度的比较不是很合适。我们简单修改一下数据。假设是两种东西产品A和产品B的一个月销量。
newData2019<-data.frame(c(1:31),tempData2019[,2])
names(newData2019) <- c("date","sales")
newData2020<-data.frame(c(1:31),tempData2020[,2])
names(newData2020) <- c("date","sales")
newData <- rbind(newData2019, newData2020)
product<- vector(length=62, mode="character")
product[1:31] <- "producet A"
product[31:62] <- "producet B"
newData <- cbind(newData,product)
newData$product <- as.factor(newData$product)

ggplot(newData, aes(x=date,y=sales,fill=product))  +
  geom_area()
百分比面积图 100% stacked area chart
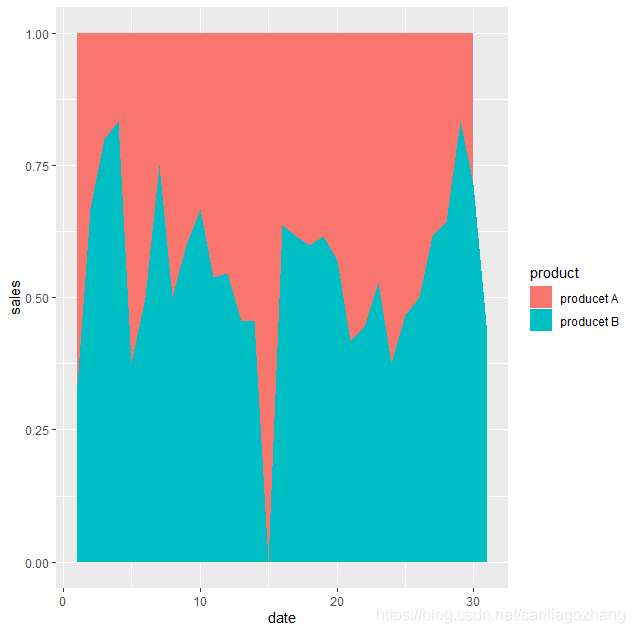
基于堆积面积图的数据,将position设置为position_fill()。生成的就是百分比面积图。
ggplot(newData, aes(x=date,y=sales,fill=product))  +
  geom_area(position = position_fill())
geom_ribbon
geom_ribbon绘制了一个有着最大ymax和最小ymin值的区间图。geom_area是geom_ribbon的一种特殊情况,它的ymin是0.
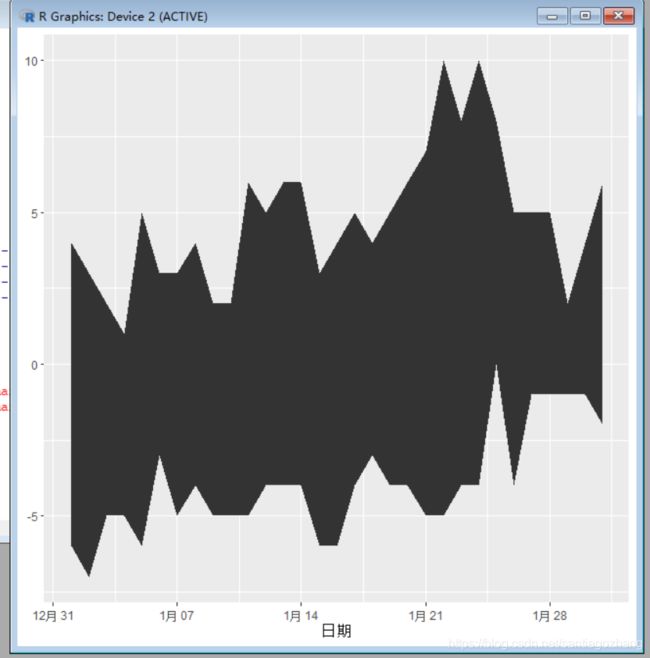
我找了一个北方城市2019年的一月份温度数据。我们来看看ribbon显示的最高温和最低温的区间图。在画这个图是遇到一个问题,图一直显示不出来,后来发现是日期变量不是POSIXct类型,是factor。转变成datetime类型后,图就成功了。
tempData <- read.csv("2019-01.csv", encoding="UTF-8")
tempData[,1] <- as.POSIXct(tempData[,1])
head(tempData)
        日期 高温 低温
1 2019-01-01    4   -6
2 2019-01-02    3   -7
3 2019-01-03    2   -5
4 2019-01-04    1   -5
5 2019-01-05    5   -6
6 2019-01-06    3   -3


ggplot(tempData, aes(x=日期))  + geom_ribbon(aes(ymin=低温, ymax=高温))


