R-Squared and adjusted R-Squared
The easiest way to check the accuracy of a model is by looking at the R-squared value.
The summary provides two R-squared values, namely Multiple R-squared, and Adjusted R-squared.
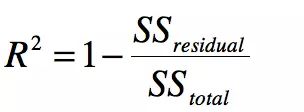
The Multiple R-squared is calculated as follows:
Multiple R-squared = 1 – SSE/SST where:
SSE is the sum of square of residuals. Residual is the difference between the predicted value and the actual value.
SST is the total sum of squares. It is calculated by summing the squares of difference between the actual value and the mean value.


For example,
lets say that we have 5, 6, 7, and 8, and a model predicts the outcomes as 4.5, 6.3, 7.2, and 7.9. Then,
SSE can be calculated as: SSE = (5 – 4.5) ^ 2 + (6 – 6.3) ^ 2 + (7 – 7.2) ^ 2 + (8 – 7.9) ^ 2;
and
SST can be calculated as: mean = (5 + 6 + 7 + 8) / 4 = 6.5; SST = (5 – 6.5) ^ 2 + (6 – 6.5) ^ 2 + (7 – 6.5) ^ 2 + (8 – 6.5) ^ 2
The Adjusted R-squared value is similar to the Multiple R-squared value,
but it accounts for the number of variables. This means that the Multiple R-squared will always increase
when a new variable is added to the prediction model, but if the variable is a non-significant one, the Adjusted R-squared value will decrease.
For more info, refer here.
An R-squared value of 1 means that it is a perfect prediction model,
R-squared or R2 explains the degree to which your input variables explain the variation of your output / predicted variable. So, if R-square is 0.8, it means 80% of the variation in the output variable is explained by the input variables. So, in simple terms, higher the R squared, the more variation is explained by your input variables and hence better is your model.
However, the problem with R-squared is that it will either stay the same or increase with addition of more variables, even if they do not have any relationship with the output variables. This is where “Adjusted R square” comes to help. Adjusted R-square penalizes you for adding variables which do not improve your existing model.

Meaning of Adjusted R2
Both R2 and the adjusted R2 give you an idea of how many data points fall within the line of the regression equation. However, there is one main difference between R2 and the adjusted R2: R2 assumes that every single variable explains the variation in the dependent variable. The adjusted R2 tells you the percentage of variation explained by only the independent variables that actually affect the dependent variable.
How Adjusted R2 Penalizes You
The adjusted R2 will penalize you for adding independent variables (K in the equation) that do not fit the model. Why? In regression analysis, it can be tempting to add more variables to the data as you think of them. Some of those variables will be significant, but you can’t be sure that significance is just by chance. The adjusted R2 will compensate for this by that penalizing you for those extra variables.
While values are usually positive, they can be negative as well. This could happen if your R2 is zero; After the adjustment, the value can dip below zero. This usually indicates that your model is a poor fit for your data. Other problems with your model can also cause sub-zero values, such as not putting a constant term in your model.
Problems with R2 that are corrected with an adjusted R2
- R2 increases with every predictor added to a model. As R2 always increases and never decreases, it can appear to be a better fit with the more terms you add to the model. This can be completely misleading.
- Similarly, if your model has too many terms and too many high-order polynomials you can run into the problem of over-fitting the data. When you over-fit data, a misleadingly high R2 value can lead to misleading projections.
Hence, if you are building Linear regression on multiple variable, it is always suggested that you use Adjusted R-squared to judge goodness of model. In case you only have one input variable, R-square and Adjusted R squared would be exactly same.
Typically, the more non-significant variables you add into the model, the gap in R-squared and Adjusted R-squared increases.