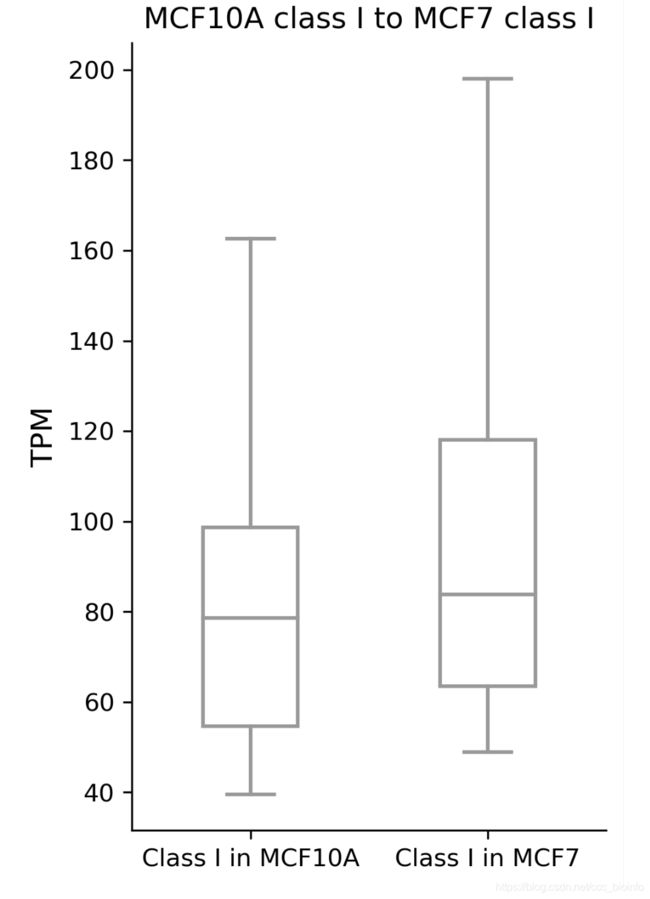
seaborn箱线图缩小两个箱子间距,使得图像更紧密
最近完善论文里的图,需要画箱线图,使用seaborn。一直画出来两个箱子间隔很大的图,最终找到解决办法:
1)aspect改变两个箱子的间距
2)fliersize=0删除图里的异常值
def drawboxline(da,a,b):
    aa='Class '+a+' in MCF10A'
    bb='Class '+b+' in MCF7'
    da.columns=[aa,bb]
    ns.factorplot(kind='box',data=da,palette={
     aa:'white',bb:'white'}, aspect=.67,width=.4,fliersize=0)
    plt.ylabel('TPM',fontsize=12)
    plt.title('MCF10A class '+a+' to MCF7 class '+b,fontsize=12)
    plt.savefig(savepath+'\\'+a+'→'+b+'.png',dpi=300, bbox_inches = 'tight')
做完发现box边框的颜色是灰的,而不是纯黑。
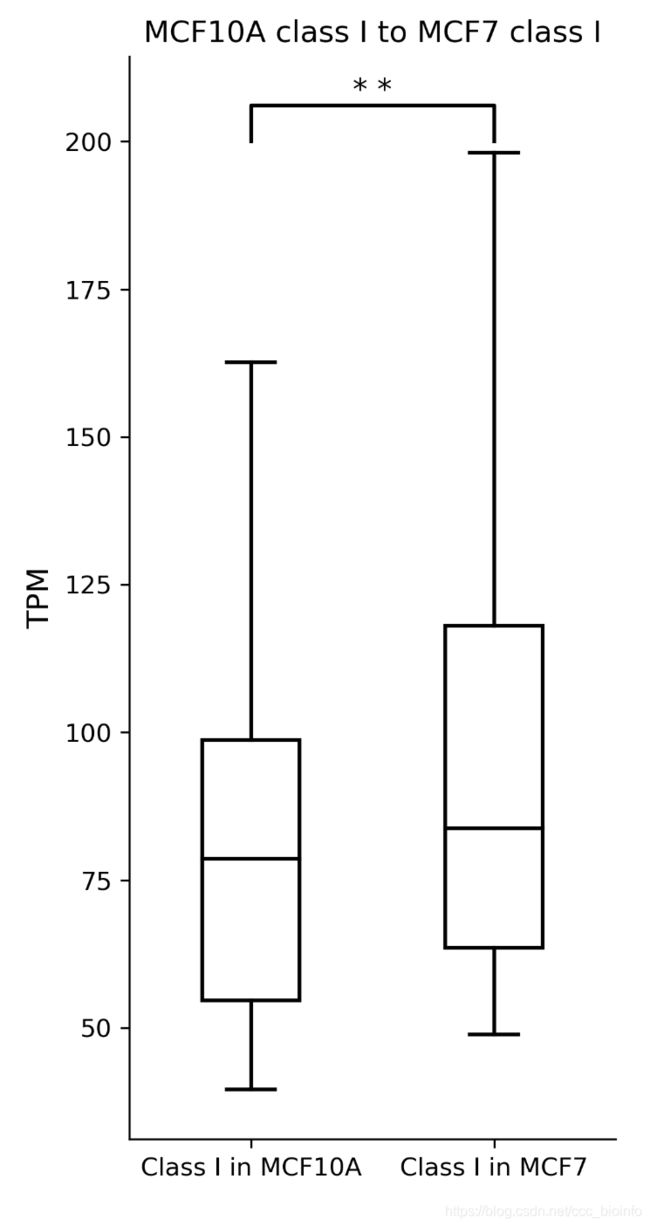
解决办法是放弃factorplot,改用boxplot,此时可以用ax.artists[0].set_facecolor(‘w’)来使box变白,而边框仍使黑色。
这时间距问题不能由aspect解决,引入新的解决办法:plt.figure(figsize=(3.5, 8))
另外两个待解决的问题是:
1)加入代表P的星星,引入秩和检验。
2)删除上边和右边的边框,使用sns.despine()
def drawboxline(da,a,b,p):
    aa='Class '+a+' in MCF10A'
    bb='Class '+b+' in MCF7'
    da.columns=[aa,bb]
    text=''
    if p<0.0001:text='* * *'
    elif p<0.01:text='* *'
    elif p<0.05:text='*'
    '''
    sns.factorplot(kind='box',data=da,palette={aa:'gainsboro',bb:'grey'},width=0.5)
    plt.ylabel('TPM')
    plt.title('MCF10A class '+a+' to MCF7 class '+b)
    plt.savefig(savepath+'\\'+a+'→'+b+'.png',dpi=300, bbox_inches = 'tight')
    '''
    plt.figure(figsize=(3.5, 8))
    ax=sns.boxplot(data=da,color='k',width=.4,fliersize=0)
    plt.ylabel('TPM',fontsize=12)
    plt.title('MCF10A class '+a+' to MCF7 class '+b,fontsize=12)
    ax.artists[0].set_facecolor('w')
    ax.artists[1].set_facecolor('w')
    #加秩和检验结果
    x1, x2 = 0, 1   # columns 'Sat' and 'Sun' (first column: 0, see plt.xticks())
    top=da.max().max()
    y = top+2
    if y<50:h=0.75
    if y<20:h=0.3
    else : h=top//30
    plt.plot([x1, x1, x2, x2], [y, y+h, y+h, y], lw=1.5, c=col)
    plt.text((x1+x2)*.5, y+h, text, ha='center', va='bottom', color='k',fontsize=12)
    sns.despine()#消除上边和右边的边框
    plt.savefig(savepath+'\\'+a+'→'+b+'.png',dpi=300, bbox_inches = 'tight')