python3.ML.Seaborn画图REG-回归分析绘图(是否付小费数据案例)
获取是否付小费数据
regplot()和lmplot()都可以绘制回归关系,推荐regplot()
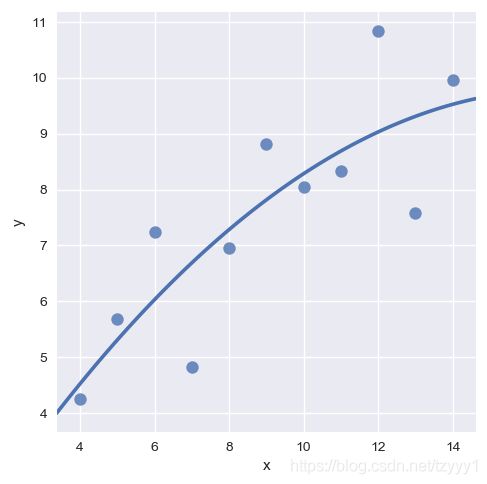
sns.lmplot(x="x", y="y", data=XXX, order=2); #曲线
利用hue参数画出男女给予小费的不同
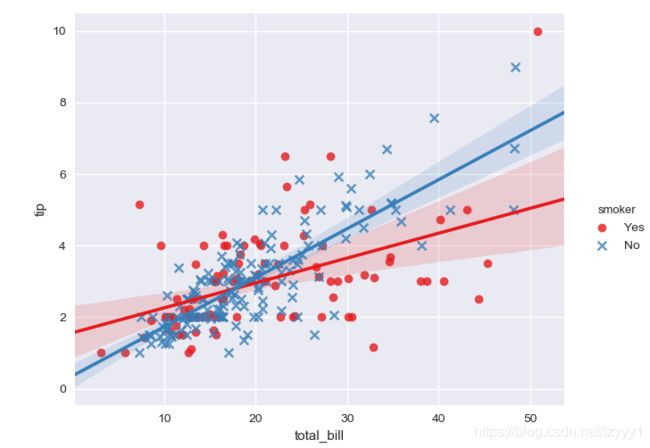
sns.lmplot(palette="Set1");#lmplot中加入调色板palette
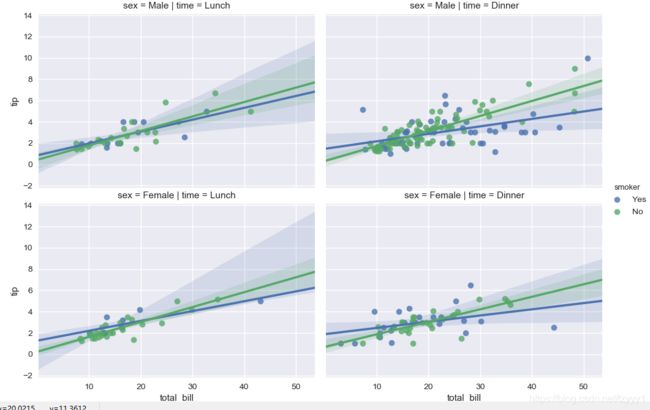
sns.lmplot(col="time", row="sex");#lmplot中加入col、row参数
参数ax
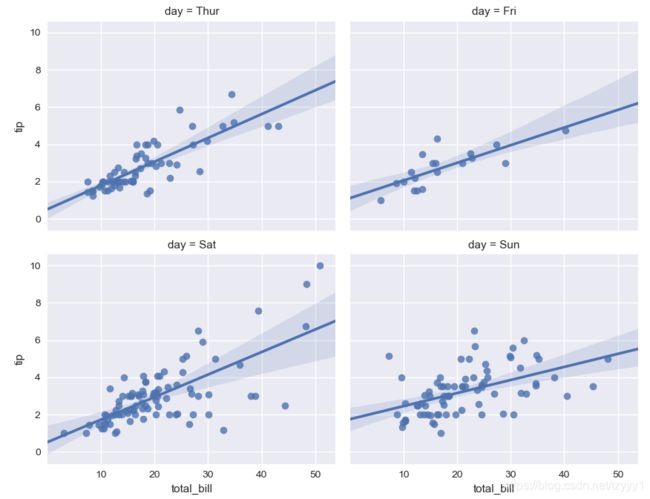
col_wrap:“包装”列变量在这个宽度,这列方面跨越多个行
size :身高(英寸)的每个方面
获取是否付小费数据
-
#!/usr/bin/python
-
# -*- coding: UTF-8 -*-
-
-
# %matplotlib inline
-
import numpy
as np
-
import pandas
as pd
-
import matplotlib
as mpl
-
import matplotlib.pyplot
as plt
-
-
import seaborn
as sns
-
sns.set(color_codes=
True)
-
np.random.seed(sum(map(ord,
"regression")))
-
tips = sns.load_dataset(
"tips")
-
print(tips.head())
-
'''
-
total_bill tip sex smoker day time size
-
0 16.99 1.01 Female No Sun Dinner 2
-
1 10.34 1.66 Male No Sun Dinner 3
-
2 21.01 3.50 Male No Sun Dinner 3
-
3 23.68 3.31 Male No Sun Dinner 2
-
4 24.59 3.61 Female No Sun Dinner 4
-
'''
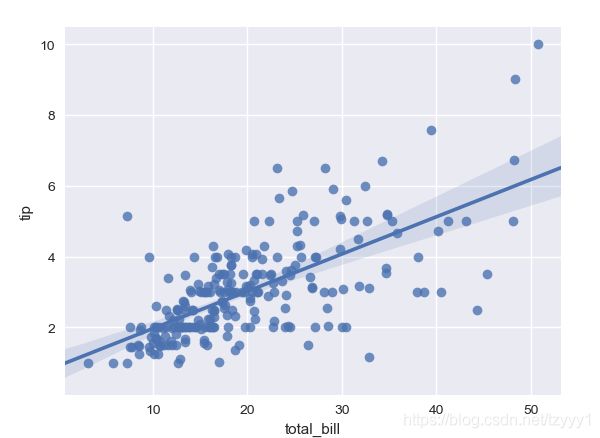
regplot()和lmplot()都可以绘制回归关系,推荐regplot()
sns.regplot(x="total_bill", y="tip", data=tips)
sns.lmplot(x="total_bill", y="tip", data=tips);
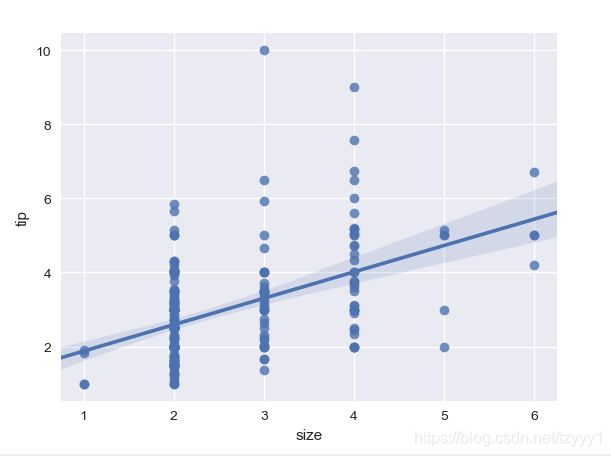
sns.regplot(data=tips,x="size",y="tip")
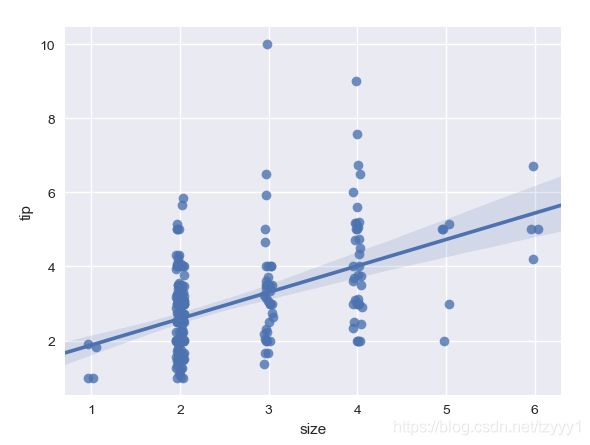
sns.regplot(x="size", y="tip", data=tips, x_jitter=.05)
-
anscombe = sns.load_dataset(
"anscombe")
-
sns.regplot(x=
"x", y=
"y", data=anscombe.query(
"dataset == 'I'"),
-
ci=
None, scatter_kws={
"s":
100})
-
anscombe = sns.load_dataset(
"anscombe")
-
sns.lmplot(x=
"x", y=
"y", data=anscombe.query(
"dataset == 'II'"),
-
ci=
None, scatter_kws={
"s":
80})
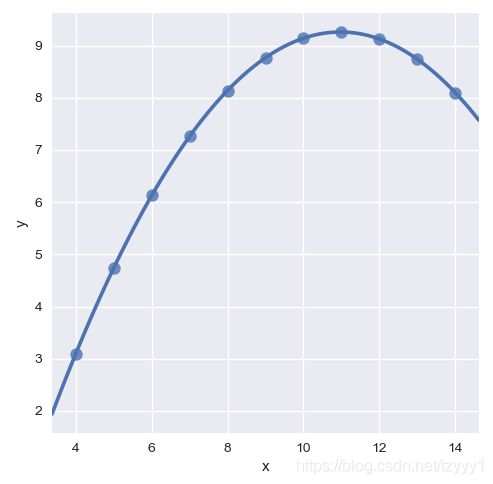
sns.lmplot(x="x", y="y", data=XXX, order=2); #曲线
-
sns.lmplot(x=
"x", y=
"y", data=anscombe.query(
"dataset == 'II'"),
-
order=
2, ci=
None, scatter_kws={
"s":
80});
-
sns.lmplot(x=
"x", y=
"y", data=anscombe.query(
"dataset == 'I'"),
-
order=
2, ci=
None, scatter_kws={
"s":
80});
利用hue参数画出男女给予小费的不同
sns.lmplot(x="total_bill", y="tip", hue="sex", data=tips);
sns.lmplot(palette="Set1");#lmplot中加入调色板palette
-
sns.lmplot(x=
"total_bill", y=
"tip", hue=
"smoker",
data=tips,
-
markers=[
"o",
"x"], palette=
"Set1");
-
colors = [
"windows blue",
"amber",
"greyish",
"faded green",
"dusty purple"]
-
sns.lmplot(x=
"total_bill", y=
"tip", hue=
"smoker",
data=tips,
-
markers=[
"o",
"x"], palette=sns.xkcd_palette(colors));
sns.lmplot(col="time", row="sex");#lmplot中加入col、row参数
-
sns.lmplot(x=
"total_bill", y=
"tip", hue=
"smoker",
-
col=
"time", row=
"sex",
data=tips);
参数ax
-
f, ax = plt.subplots(figsize=(
5,
5))
-
sns.regplot(x=
"total_bill", y=
"tip",
data=tips, ax=ax);
col_wrap:“包装”列变量在这个宽度,这列方面跨越多个行
size :身高(英寸)的每个方面
-
sns.lmplot(x=
"total_bill", y=
"tip", col=
"day",
data=tips,
-
col_wrap=
2, size=
4);
-
sns.lmplot(x=
"total_bill", y=
"tip", col=
"day",
data=tips,
-
col_wrap=
3, size=
4);
-
sns.lmplot(x=
"total_bill", y=
"tip", col=
"day",
data=tips,
-
aspect=
.8);
