GIS开发中的区域定位功能实现
开发工具与关键技术: SuperMap iDesktop 9D   GIS
作者:杨泽平
撰写时间:2020、4、20
SuperMap GIS的二次开发,这是基于SuperMap iDesktop 根据实际的数据所制作的地图来进行开发,开发的用途主要是用于比如一些区域的防疫系统的线上平台,以及土地规划等,地图的二次开发大致就是,把制作好的地图,发布到isever服务器上,然后通过路径调用显示在项目上,再基于JavaScript代码进行开发他的一些实用功能。
这些功能有很多,比如一些测距离,测面积等等,简单介绍我做项目写的一个功能,这是一个区域定位的功能,区域定位,获取区域要根据地图数据源里数据集的数据来获取,读取到数据集里的数据之后再通过JavaScript代码让他以你想要的方式来展示出来。
首先我们准备好地图并发布到isever服务器上,

然后通过JavaScript来把他显示在项目上,准备一个HTML容器来显示地图,地图的显示需要通过路径调用,

还有给它添加一下控件,添加图层就可以显示出来了,代码如下图:


然后我们就可以写区域定位的代码了,首先HTML的样式代码如下,
这是部分,注意第一幅图画圈那个值,他是要与数据集里的SmID值对应图二画圈那个
下面就是实现代码了,先是获取区域定位的代码,根据数据数据源数据集获取,如下
//获取区域定位
    $("input[name='xcv']").click(function () {
        var fd = $("[name='xcv']:checked").val();
        var index = $("[name='xcv']:checked").attr("index");
        $("#sdfg").text(fd);
           vectorLayersd.removeAllFeatures();//removeAllFeatures:清除当前图层所有的矢量要素
        var getFeaturesByIDsParameters, getFeaturesByIDsService;
        getFeaturesByIDsParameters = new SuperMap.REST.GetFeaturesByIDsParameters({
            returnContent: true,
            datasetNames: ["gzbyqChronicDisease :社区_region1"],//数据源和数据集
            fromIndex: 0,
            toIndex: -1,
            IDs: [index]
        });
        getFeaturesByIDsService = new SuperMap.REST.GetFeaturesByIDsService(url2, {
            eventListeners: { "processCompleted": processCompletedfg, "processFailed": processFailed }
        });
        getFeaturesByIDsService.processAsync(getFeaturesByIDsParameters);
    });
然后获取到区域的数据后就根据你想要的显示样式通过代码把它写出来,这里我写了放大,颜色等,如下:
function processCompletedfg(getFeaturesEventArgs) {
        var i, len, features, feature, result = getFeaturesEventArgs.result, bounds, N = [], S = [], W = [], E = [];
        if (result && result.features) {
            features = result.features
            for (i = 0, len = features.length; i < len; i++) {
                feature = features[i];
                feature.style = style;
                feature.style = {
                    strokeColor: 'Orange',//边颜色
                    strokeWidth: 1,//边宽度
                    strokeDashstyle: 'solid',//边类型,虚线
                    fillColor: 'Orange',//填充颜色
                    //fill:false,
                    fillOpacity: 0.15,//透明度
                    label: feature.data.NAME,
                    fontColor: 'red',
                    fontOpacity: "1",//{Number} 标签透明度 (0-1)。
                    fontSize: '16px',
                    fontWeight: 700
                };
                vectorLayersd.addFeatures(feature);
                bounds = feature.geometry.bounds;
                if (bounds != null) {
                    if (bounds.top != null && Boolean(bounds.top) == true) {
                        N.push(Number(bounds.top));
                    }
                    if (bounds.bottom != null && Boolean(bounds.bottom) == true) {
                        S.push(Number(bounds.bottom));
                    }
                    if (bounds.left != null && Boolean(bounds.left) == true) {
                        W.push(Number(bounds.left));
                    }
                    if (bounds.right != null && Boolean(bounds.right) == true) {
                        E.push(Number(bounds.right));
                    }
                }
            }
        }
             if (W.length > 0 && S.length > 0 && E.length > 0 && N.length > 0) {
            var bounds = new SuperMap.Bounds(
                                          Math.min.apply(null, W),//最小的水平坐标系。
                                          Math.min.apply(null, S),//最小的垂直坐标系。
                                          Math.max.apply(null, E),//最大的水平坐标系。
                                          Math.max.apply(null, N) //最大的垂直坐标系。
                                      );

            map.zoomToExtent(bounds);//缩放到指定范围,重新定位中心点。
        }
    }
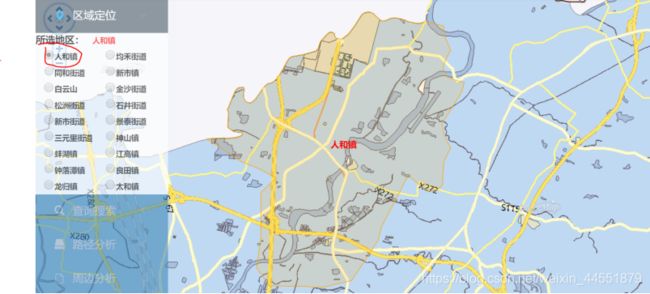
写完样式代码后区域定位这个功能就可以了,来看一下效果,如下图:
点击你要定位的镇,地图上就会显示出你所选的镇的区域定位。
在GIS开发里学到许多新的知识,也还有许多待探索的知识在等待我们,这个小功能只是学到的一部分,还有许许多多的强大的功能等待我们去探索开发。


