密度图处理
在AI Stdio上碰到一个计算人流密度的项目,其中baseline使用的方法是将人像框变成密度函数。首先将人相框转化为点,即将方框标注变为点标注
''
图片操作:对图片进行resize、归一化,将方框标注变为点标注
返回:resize后的图片 和 gt
'''
def picture_opt(img,ann):
    size_x,size_y = img.size
    train_img_size = (640,480)
    img = img.resize(train_img_size,Image.ANTIALIAS)
    img = np.array(img)
    img = img / 255.0

    gt = []
    for b_l in range(len(ann)):
        # 假设人体是使用方框标注的,通过求均值的方法将框变为点
        if 'w' in ann[b_l].keys():
            x = (ann[b_l]['x']+(ann[b_l]['x']+ann[b_l]['w']))/2
            y = ann[b_l]['y']+20
            x = (x*640/size_x)/8
            y = (y*480/size_y)/8
            gt.append((x,y))
        else:
            x = ann[b_l]['x']
            y = ann[b_l]['y']
            x = (x*640/size_x)/8
            y = (y*480/size_y)/8
            gt.append((x,y))

    return img,gt
上述代码实现将图片的框标注转化为点标注,返回的是点的二维坐标和归一化,resize之后的图片,再将图片和点标注进行密度图处理,代码如下
'''
使用高斯滤波变换生成密度图
'''
#gt为一些点的集合
def gaussian_filter_density(gt):

    # 初始化密度图
    density = np.zeros(gt.shape, dtype=np.float32)

    # 获取gt中不为0的元素的个数
    gt_count = np.count_nonzero(gt)

    # 如果gt全为0,就返回全0的密度图
    if gt_count == 0:
        return density

    pts = np.array(list(zip(np.nonzero(gt)[1].ravel(), np.nonzero(gt)[0].ravel())))


    for i, pt in enumerate(pts):
        pt2d = np.zeros(gt.shape, dtype=np.float32)
        pt2d[pt[1],pt[0]] = 1.
        if gt_count > 1:
            # sigma = (distances[i][1]+distances[i][2]+distances[i][3])*0.1
            sigma = 25
        else:
            sigma = np.average(np.array(gt.shape))/2./2.

        density += scipy.ndimage.filters.gaussian_filter(pt2d, sigma, mode='constant')

    return density
'''
密度图处理
'''
def ground(img,gt):
    imgs = img
    x = imgs.shape[0]/8
    y = imgs.shape[1]/8
    k = np.zeros((int(x),int(y)))#定义一个大小与图片尺寸一样的矩阵

    for i in range(0,len(gt)):
        if int(gt[i][1]) < int(x) and int(gt[i][0]) < int(y):
            k[int(gt[i][1]),int(gt[i][0])]=1

    k = gaussian_filter_density(k)
    return k


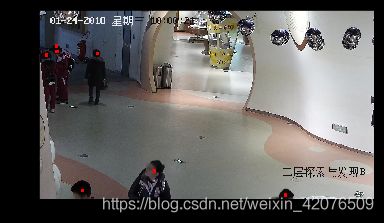
ig_cv_img2 = cv2.imread(content['annotations'][1]['name'])
ig_img2 = Image.fromarray(cv2.cvtColor(ig_cv_img2,cv2.COLOR_BGR2RGB))   #cv2转PIL
ann = content['annotations'][1]['annotation']                    #把所有标注的信息读取出来

ig_im,gt = picture_opt(ig_img2,ann)
plt.figure(1)
plt.imshow(ig_im)
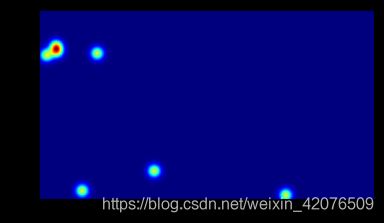
k = ground(ig_im,gt)
groundtruth = np.asarray(k)

plt.figure(2)
plt.imshow(groundtruth,cmap=CM.jet)
groundtruth = groundtruth.T.astype('float32')
ig_im = ig_im.transpose().astype('float32')
处理之后得到的密度图如下:

