grafana配置邮件发送
- grafana的邮件配置文件是/etc/grafana/grafana.ini,新建grafana.ini文件,内容如下。
chown 472:472 grafana.ini
#################################### SMTP / Emailing ##########################
[smtp]
enabled = true
#是否允许开启
host = smtp.ym.163.com:465
#发送服务器地址,可以再邮箱的配置教程中找到:
user = 你的邮箱

password = 你的密码
;cert_file =
;key_file =
;skip_verify = false
from_address = 你的邮箱
from_name = Grafana
# EHLO identity in SMTP dialog (defaults to instance_name)
ehlo_identity = http://192.168.10.225:3000
[emails]
;welcome_email_on_sign_up = true
#################################### Logging ##########################
- 修改docker-compose.yml文件,将刚才的文件挂载进去并重启grafana。
###############grafana###############
  grafana:
    image: "grafana/grafana"
    hostname: grafana
    container_name: grafana
    ports:
      - '3000:3000'
    volumes:
      - /wdata/server/grafana/db/:/var/lib/grafana/
      - /wdata/server/grafana/etc/grafana.ini:/etc/grafana/grafana.ini
    #environment:
    #  - TZ=Asia/Shanghai
    restart: always
    #tty: true
    network_mode: host
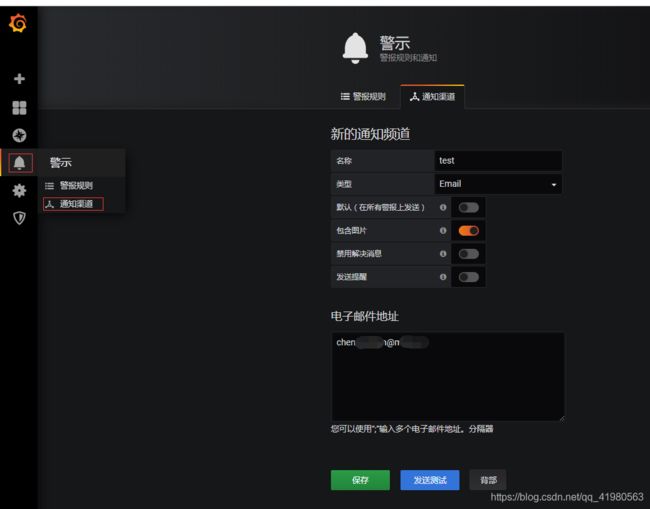
-
在消息通知那里测试邮件。
-
进入邮箱查看邮件已成功发送。
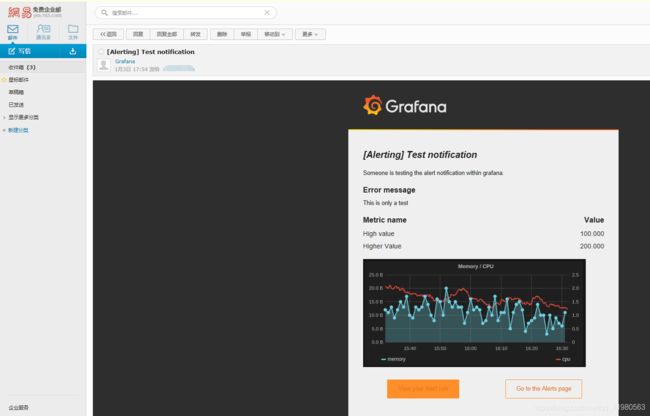
-
点击邮件内容跳转到grafana,发现跳转到的是localhost,无法跳转到grafana地址。

-
仔细检查发现grafana还有个默认配置/usr/share/grafana/conf/defaults.ini,将/usr/share/grafana/conf/defaults.ini内容复制出来并修改domain = localhost为domain = 你grafana访问URL
##################### Grafana Configuration Defaults #####################
#
# Do not modify this file in grafana installs
#
# possible values : production, development
app_mode = production
# instance name, defaults to HOSTNAME environment variable value or hostname if HOSTNAME var is empty
instance_name = ${HOSTNAME}
#################################### Paths ###############################
[paths]
# Path to where grafana can store temp files, sessions, and the sqlite3 db (if that is used)
data = data
# Temporary files in `data` directory older than given duration will be removed
temp_data_lifetime = 24h
# Directory where grafana can store logs
logs = data/log
# Directory where grafana will automatically scan and look for plugins
plugins = data/plugins
# folder that contains provisioning config files that grafana will apply on startup and while running.
provisioning = conf/provisioning
#################################### Server ##############################
[server]
# Protocol (http, https, h2, socket)
protocol = http
# The ip address to bind to, empty will bind to all interfaces
http_addr =
# The http port to use
http_port = 3000
# The public facing domain name used to access grafana from a browser
domain = 192.168.10.225
# Redirect to correct domain if host header does not match domain
# Prevents DNS rebinding attacks
enforce_domain = false
# The full public facing url
root_url = %(protocol)s://%(domain)s:%(http_port)s/
# Serve Grafana from subpath specified in `root_url` setting. By default it is set to `false` for compatibility reasons.
serve_from_sub_path = false
# Log web requests
router_logging = false
# the path relative working path
static_root_path = public
# enable gzip
enable_gzip = false
# https certs & key file
cert_file =
cert_key =
# Unix socket path
socket = /tmp/grafana.sock
#################################### Database ############################
[database]
# You can configure the database connection by specifying type, host, name, user and password
# as separate properties or as on string using the url property.
# Either "mysql", "postgres" or "sqlite3", it's your choice
type = sqlite3
host = 127.0.0.1:3306
name = grafana
user = root
# If the password contains # or ; you have to wrap it with triple quotes. Ex """#password;"""
password =
# Use either URL or the previous fields to configure the database
# Example: mysql://user:secret@host:port/database
url =
# Max idle conn setting default is 2
max_idle_conn = 2
# Max conn setting default is 0 (mean not set)
max_open_conn =
# Connection Max Lifetime default is 14400 (means 14400 seconds or 4 hours)
conn_max_lifetime = 14400
# Set to true to log the sql calls and execution times.
log_queries =
# For "postgres", use either "disable", "require" or "verify-full"
# For "mysql", use either "true", "false", or "skip-verify".
ssl_mode = disable
ca_cert_path =
client_key_path =
client_cert_path =
server_cert_name =
# For "sqlite3" only, path relative to data_path setting
path = grafana.db
# For "sqlite3" only. cache mode setting used for connecting to the database
cache_mode = private
#################################### Cache server #############################
[remote_cache]
# Either "redis", "memcached" or "database" default is "database"
type = database
# cache connectionstring options
# database: will use Grafana primary database.
# redis: config like redis server e.g. `addr=127.0.0.1:6379,pool_size=100,db=0,ssl=false`. Only addr is required. ssl may be 'true', 'false', or 'insecure'.
# memcache: 127.0.0.1:11211
connstr =
#################################### Data proxy ###########################
[dataproxy]
# This enables data proxy logging, default is false
logging = false
# How long the data proxy should wait before timing out default is 30 (seconds)
timeout = 30
# If enabled and user is not anonymous, data proxy will add X-Grafana-User header with username into the request, default is false.
send_user_header = false
#################################### Analytics ###########################
[analytics]
# Server reporting, sends usage counters to stats.grafana.org every 24 hours.
# No ip addresses are being tracked, only simple counters to track
# running instances, dashboard and error counts. It is very helpful to us.
# Change this option to false to disable reporting.
reporting_enabled = true
# Set to false to disable all checks to https://grafana.com
# for new versions (grafana itself and plugins), check is used
# in some UI views to notify that grafana or plugin update exists
# This option does not cause any auto updates, nor send any information
# only a GET request to https://grafana.com to get latest versions
check_for_updates = true
# Google Analytics universal tracking code, only enabled if you specify an id here
google_analytics_ua_id =
# Google Tag Manager ID, only enabled if you specify an id here
google_tag_manager_id =
#################################### Security ############################
[security]
# disable creation of admin user on first start of grafana
disable_initial_admin_creation = false
# default admin user, created on startup
admin_user = admin
# default admin password, can be changed before first start of grafana, or in profile settings
admin_password = admin
# used for signing
secret_key = SW2YcwTIb9zpOOhoPsMm
# disable gravatar profile images
disable_gravatar = false
# data source proxy whitelist (ip_or_domain:port separated by spaces)
data_source_proxy_whitelist =
# disable protection against brute force login attempts
disable_brute_force_login_protection = false
# set to true if you host Grafana behind HTTPS. default is false.
cookie_secure = false
# set cookie SameSite attribute. defaults to `lax`. can be set to "lax", "strict" and "none"
cookie_samesite = lax
# set to true if you want to allow browsers to render Grafana in a ,