使用Numpy拟合贝塞尔曲线
贝塞尔曲线: 通过起点、终点以及多个控制点绘制得到的曲线,Photoshop中的钢笔工具就是贝塞尔曲线。另外,CSS中动画的计时函数也有三次贝塞尔曲线,例如常用的ease - cubic-bezier(0.25,0.1,0.25,1), ease-in-out - cubic-bezier(0.42,0,0.58,1)。贝塞尔曲线的通用计算公式为 B ( t ) = Σ i = 0 n ( n i ) P i ( 1 − t ) n − i t i , 0 ≤ t ≥ 1 B(t)=\Sigma_{i=0}^{n}\binom{n}{i}Pi(1-t)^{n-i}t^i, 0 \le t \ge 1 B(t)=Σi=0n(in)Pi(1−t)n−iti,0≤t≥1,其中t可以理解为时刻,Pi表示控制点(包括起终点)。
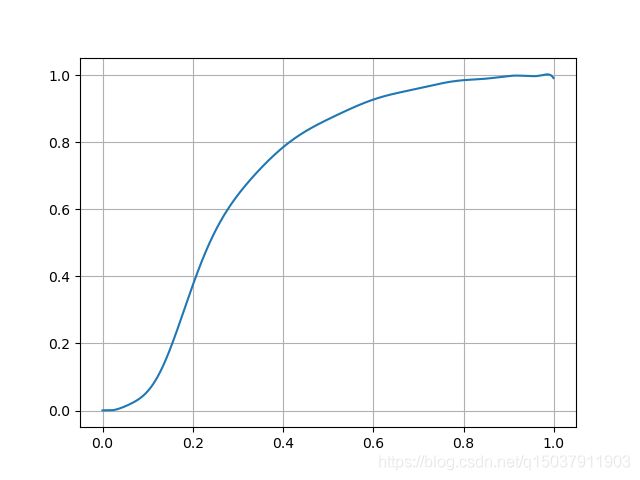
本文使用Numpy拟合三次贝塞尔曲线cubic-bezier(0.3,0,0,1),其图像如下:

可以使用geogebra查看拟合后的曲线在整个坐标轴上的结果,本文中拟合后的结果为: − 5634657.187995095 x 16 + 45207123.80406813 x 15 + − 164321160.9410473 x 14 + 357735878.3266866 x 13 + − 519499735.0536763 x 12 + 530305734.45764804 x 11 + − 390543484.20302945 x 10 + 209498881.24963355 x 9 + − 81592649.14667341 x 8 + 22708417.585277304 x 7 + − 4379479.970961253 x 6 + 556579.9351615013 x 5 + − 43295.904223406396 x 4 + 1880.8424521764407 x 3 + − 32.99834229194805 x 2 + 0.19434715012662382 x 1 + 0.0003451401468581472 x -5634657.187995095x^{16}+45207123.80406813x^{15}+-164321160.9410473x^{14}+357735878.3266866x^{13}+-519499735.0536763x^{12}+530305734.45764804x^{11}+-390543484.20302945x^{10}+209498881.24963355x^{9}+-81592649.14667341x^{8}+22708417.585277304x^{7}+-4379479.970961253x^{6}+556579.9351615013x^{5}+-43295.904223406396x^{4}+1880.8424521764407x^{3}+-32.99834229194805x^{2}+0.19434715012662382x^{1}+0.0003451401468581472x −5634657.187995095x16+45207123.80406813x15+−164321160.9410473x14+357735878.3266866x13+−519499735.0536763x12+530305734.45764804x11+−390543484.20302945x10+209498881.24963355x9+−81592649.14667341x8+22708417.585277304x7+−4379479.970961253x6+556579.9351615013x5+−43295.904223406396x4+1880.8424521764407x3+−32.99834229194805x2+0.19434715012662382x1+0.0003451401468581472x,挺长的emmm
拟合过程:
- 以间隔0.001计算每个t时对应的坐标(x,y)
- 使用pyplot绘制曲线
- 使用
np.polyfit(x, y, deg)拟合曲线 - 绘制拟合后的曲线,根据结果调整
deg参数(即多项式的最高次)
代码如下
from matplotlib import pyplot as plt
import numpy as np

p0 = (0, 0)
p1 = (0, 0)
p2 = (1, 1)
p3 = (1, 1)

def calculateP(t: float):
    """
    根据p0~p3计算时刻t曲线的坐标,0 <= t <= 1,曲线: cubic-bezier(.4,0,0,1)
    p0      p1          p2      p3
    (0, 0)  (0.4, 0)    (0, 1)  (1, 1)

    返回一个(x, y)
    """
    tmp = 1 - t
    x = p0[0] * pow(tmp, 3) + 3 * p1[0] * t * pow(tmp, 2) + 3 * \
        p2[0] * pow(t, 2) * tmp + 1 * p3[0] * pow(t, 3)
    y = p0[1] * pow(tmp, 3) + 3 * p1[1] * t * pow(tmp, 2) + 3 * \
        p2[1] * pow(t, 2) * tmp + 1 * p3[1] * pow(t, 3)
    return (x, y)

def getPoints(dis, calc: callable):
    """
    获取三次贝塞尔曲线的离散点,参数 dis 指定离散点的间距,calc 指定计算函数

    返回一个坐标列表[(x,y)]
    """
    if dis <= 0:
        return [(0, 0)]
    t = 0
    res = []
    while t < 1:
        res.append(calc(t))
        t += dis
    return res

def showCurve(points):
    """ 绘制 points 中的点 """
    # plt.figure(figsize=(5, 5))
    plt.subplot()
    plt.grid()
    plt.plot([p[0] for p in points], [p[1] for p in points])
    plt.show()

def work():
    global p1
    global p2
    dis = 0.001
    p1 = (0.3, 0)
    p2 = (0, 1)
    points = getPoints(dis, calculateP)
    showCurve(points)
    f = np.polyfit([p[0] for p in points], [p[1] for p in points], 16)
    print([x for x in f])
    f = np.poly1d(f)
    npoints = getPoints(dis, lambda x: (x, f(x)))
    showCurve(npoints)
