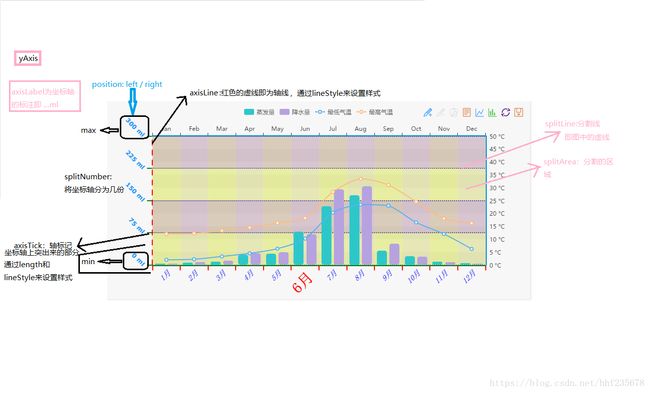
Echart中的柱状图、折线图的纵坐标详解
option = {
    tooltip : {
        trigger: 'axis'
    },
    legend: {
        data:['蒸发量','降水量','最低气温','最高气温']
    },
    toolbox: {
        show : true,
        feature : {
            mark : {show: true},
            dataView : {show: true},
            magicType : {show: true, type: ['line', 'bar']},
            restore : {show: true},
            saveAsImage : {show: true}
        }
    },
    xAxis : [
        {
            type : 'category',
            position: 'bottom',
            boundaryGap: true,
            axisLine : {    // 轴线
                show: true,
                lineStyle: {
                    color: 'green',
                    type: 'solid',
                    width: 2
                }
            },
            axisTick : {    // 轴标记
                show:true,
                length: 10,
                lineStyle: {
                    color: 'red',
                    type: 'solid',
                    width: 2
                }
            },
            axisLabel : {
                show:true,
                interval: 'auto',    // {number}
                rotate: 45,
                margin: 8,
                formatter: '{value}月',
                textStyle: {
                    color: 'blue',
                    fontFamily: 'sans-serif',
                    fontSize: 15,
                    fontStyle: 'italic',
                    fontWeight: 'bold'
                }
            },
            splitLine : {
                show:true,
                lineStyle: {
                    color: '#483d8b',
                    type: 'dashed',
                    width: 1
                }
            },
            splitArea : {
                show: true,
                areaStyle:{
                    color:['rgba(144,238,144,0.3)','rgba(135,200,250,0.3)']
                }
            },
            data : [
                '1','2','3','4','5',
                {
                    value:'6',
                    textStyle: {
                        color: 'red',
                        fontSize: 30,
                        fontStyle: 'normal',
                        fontWeight: 'bold'
                    }
                },
                '7','8','9','10','11','12'
            ]
        },
        {
            type : 'category',
            data : ['Jan','Feb','Mar','Apr','May','Jun','Jul','Aug','Sep','Oct','Nov','Dec']
        }
    ],
    yAxis : [
        {
            type : 'value',
            position: 'left',
            min: 0,
            max: 300,
            splitNumber: 4,
            boundaryGap: [0,0.1],
            axisLine : {    // 轴线
                show: true,
                lineStyle: {
                    color: 'red',
                    type: 'dashed',
                    width: 2
                }
            },
            axisTick : {    // 轴标记
                show:true,
                length: 10,
                lineStyle: {
                    color: 'green',
                    type: 'solid',
                    width: 2
                }
            },
            axisLabel : {
                show:true,
                interval: 'auto',    // {number}
                rotate: -45,
                margin: 18,
                formatter: '{value} ml',    // Template formatter!
                textStyle: {
                    color: '#1e90ff',
                    fontFamily: 'verdana',
                    fontSize: 10,
                    fontStyle: 'normal',
                    fontWeight: 'bold'
                }
            },
            splitLine : {
                show:true,
                lineStyle: {
                    color: '#483d8b',
                    type: 'dotted',
                    width: 2
                }
            },
            splitArea : {
                show: true,
                areaStyle:{
                    color:['rgba(255,215,0,0.3)','rgba(205,92,92,0.3)','rgba(255,215,0,0.3)']
                }
            }
        },
        {
            type : 'value',
            splitNumber: 10,
            axisLabel : {
                formatter: function (value) {
                    // Function formatter
                    return value + ' °C'
                }
            },
            splitLine : {
                show: false
            }
        }
    ],
    series : [
        {
            name: '蒸发量',
            type: 'bar',
            data:[2.0, 4.9, 7.0, 23.2, 25.6, 76.7, 135.6, 162.2, 32.6, 20.0, 6.4, 3.3]
        },
        {
            name: '降水量',
            type: 'bar',
            data: [2.6, 5.9, 9.0, 26.4, 28.7, 70.7, 175.6, 182.2, 48.7, 18.8, 6.0, 2.3]
        },
        {
            name:'最低气温',
            type: 'line',
            yAxisIndex: 1,
            data: [2.0, 2.2, 3.3, 4.5, 6.3, 10.2, 20.3, 23.4, 23.0, 16.5, 12.0, 6.2]
        },
        {
            name:'最高气温',
            type: 'line',
            xAxisIndex: 1,
            yAxisIndex: 1,
            data: [12.0, 12.2, 13.3, 14.5, 16.3, 18.2, 28.3, 33.4, 31.0, 24.5, 18.0, 16.2]
        }
    ]
};
官网链接
