首先新建一个项目,当前要先在数据库设置一下。项目说简单也简单,说难也难。要用到Ajax与Raphael类库,不过更多的时候自己舞弄三角函数(做统计这少不了。)
接着删除public下的index.html,并在routes下添加:
  map.root :abilities#★★★★
  # Install the default routes as the lowest priority.
  # Note: These default routes make all actions in every controller accessible via GET requests. You should
  # consider removing the them or commenting them out if you're using named routes and resources.
  map.connect ':controller/:action/:id'
  map.connect ':controller/:action/:id.:format'
随便填几个数值。
前台show.erb用Ajax来调用数据:
<%= javascript_tag "window._token = '#{form_authenticity_token}'" if ActionController::Base.allow_forgery_protection %>
<%= javascript_include_tag :defaults,"raphael" %>
<%= link_to 'Edit', edit_ability_path(@ability) %> |
<%= link_to 'Back', abilities_path %>
利用Prototype玩Ajax就是这么简单。由于Rails2.0中加入了form_authenticity_token来防止部分的cross-site的攻击,我们需要用一个全局变量来保存这个东西,然后作为Ajax的一个变量请求回去,防止ActionController::InvalidAuthenticityToken错误。
然后在后台添加以下代码,全部包围在一个选择肢中,只有是xhr请求才会调用它们:
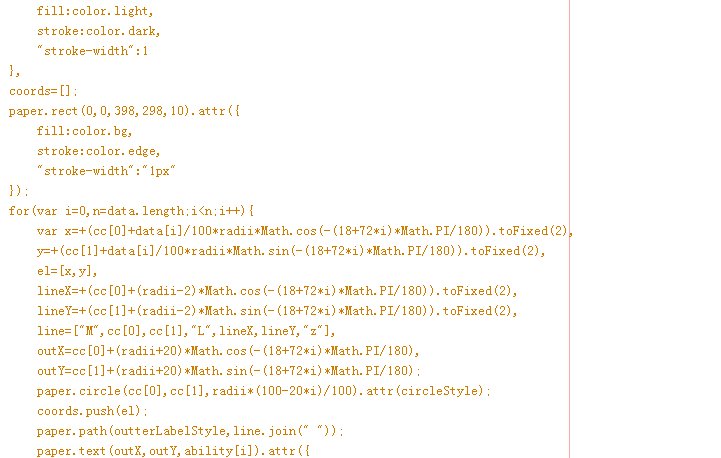
主要要点是这是个五边形,因此我们先用360/5得出得每个点偏移的角度,我们通过cos与sin求得每个点的坐标。
//以半径当作三角形的斜边
//斜边*余弦得出点投射到X轴的坐标
//斜边*正弦得出点投射到Y轴的坐标
//我们以圆心边坐标系的中心,因此要分别加上圆心的X坐标与Y坐标
    var x=圆心X坐标+半径*Math.cos(-偏移的角度)*Math.PI/180)
    var y=圆心Y坐标+半径*Math.sin(-偏移的角度)*Math.PI/180)
//角度之所以取负,是因为屏幕的坐标系与数学上的坐标系是相反的
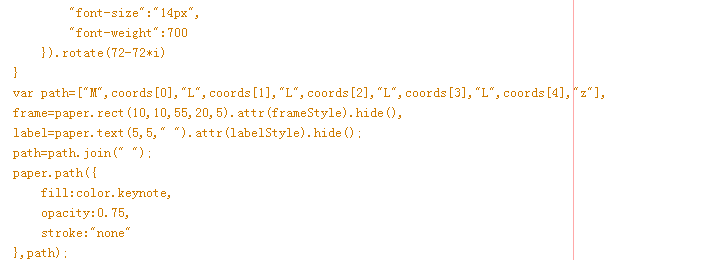
得出这五个点后,我们用path函数把它们连起来就是,和SVG的用法很相近。最后,后台截获我们的XHR请求就会完美地生成我们的雷达图。
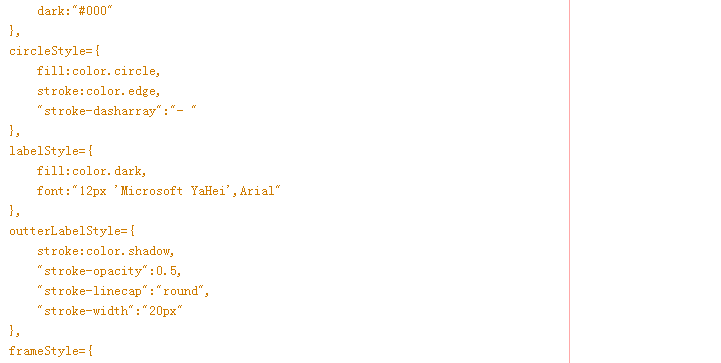
var paper=Raphael("holder",400,300),
radii=120,
cc=[200,150],
ability=["认真","聪明","人气","人品","运气"],
data=[78,90,67,100,80],
color={
    keynote:"#586F85",
    circle:"#B3E2D5",
    bg:"#EEFFEE",
    edge:"#474747",
    shadow:"#ABD7CB",
    light:"#fff",
    dark:"#000"
},
circleStyle={
    fill:color.circle,
    stroke:color.edge,
    "stroke-dasharray":"- "
},
labelStyle={
    fill:color.dark,
    font:"12px 'Microsoft YaHei',Arial"
},
outterLabelStyle={
    stroke:color.shadow,
    "stroke-opacity":0.5,
    "stroke-linecap":"round",
    "stroke-width":"20px"
},
frameStyle={
    fill:color.light,
    stroke:color.dark,
    "stroke-width":1
},
coords=[];
paper.rect(0,0,398,298,10).attr({
    fill:color.bg,
    stroke:color.edge,
    "stroke-width":"1px"
});
for(var i=0,n=data.length;i


