R软件作图学习,首先为了体验方便,我使用的R中MASS包中的自带数据集,首先加载该包
> library(MASS)
加载数据集,该数据集事保险数据统计
> data("Insurance")
> dim(Insurance)
查看数据的的行列元信息,发现是65行,5列
[1] 64 5
定义一个元信息的变量用于显示的需要
> var=c("District","Age")
> Insurance[20:25,var]
District Age
20 2 >35
21 2 <25
22 2 25-29
23 2 30-35
24 2 >35
25 2 <25
统计数据的头字段,该字段的意义,Insurance数据集是记录了某保险公司1973年的第三季度的车险投保人数的相关信息,其中
District表示投保人家庭住址所在区域,取值1-4之间,
Group表示所投保汽车的发动机排量,分为小于1升,1-1.5升,1.5-2升,大于2升的四个等级
Age表示投保人的年龄:取值小于25,25-29,30-35,大于35岁
Holders表示投保人的数量
Claims表示索赔的投保人数
可以通过attributes() 函数来查看数据的属性列表,具体包括变量名称$name,数据集格式$class,以及行名称$row.names三个部分,由此组成了数据集中的一个整体的结构。
同时可以通过str()函数继续观察数据的内部结构,会发现数据的内部一些基本信息,同时还有summary函数进行查看。
> names(Insurance)
[1] "District" "Group" "Age" "Holders" "Claims"
> head(Insurance, n=10)
District Group Age Holders Claims
1 1 <1l <25 197 38
2 1 <1l 25-29 264 35
3 1 <1l 30-35 246 20
4 1 <1l >35 1680 156
5 1 1-1.5l <25 284 63
6 1 1-1.5l 25-29 536 84
7 1 1-1.5l 30-35 696 89
8 1 1-1.5l >35 3582 400
9 1 1.5-2l <25 133 19
10 1 1.5-2l 25-29 286 52
> class(Insurance$Age)
[1] "ordered" "factor"
> levels(Insurance$Age)
[1] "<25" "25-29" "30-35" ">35"
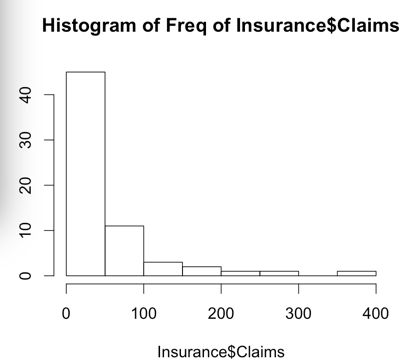
画出Claims的直方图
> hist(Insurance$Claims,main = "Histogram of Freq of Insurance$Claims")
查看直方图的内部相信信息
> str(hist)
function (x, ...)
> str(hist(Insurance$Claims,breaks=20,labels = TRUE,col = "black",border = "white",main = "Histogram of Insurance$Claims whth 20 hars"))
List of 6
$ breaks : num [1:21] 0 20 40 60 80 100 120 140 160 180 ...
$ counts : int [1:20] 30 13 5 5 3 2 0 2 0 1 ...
$ density : num [1:20] 0.02344 0.01016 0.00391 0.00391 0.00234 ...
$ mids : num [1:20] 10 30 50 70 90 110 130 150 170 190 ...
$ xname : chr "Insurance$Claims"
$ equidist: logi TRUE
- attr(*, "class")= chr "histogram"
> str(hist(Insurance$Claims,breaks=20,labels = TRUE,col = "yellow",border = "white",main = "Histogram of Insurance$Claims whth 20 hars"))
List of 6
$ breaks : num [1:21] 0 20 40 60 80 100 120 140 160 180 ...
$ counts : int [1:20] 30 13 5 5 3 2 0 2 0 1 ...
$ density : num [1:20] 0.02344 0.01016 0.00391 0.00391 0.00234 ...
$ mids : num [1:20] 10 30 50 70 90 110 130 150 170 190 ...
$ xname : chr "Insurance$Claims"
$ equidist: logi TRUE
- attr(*, "class")= chr "histogram"
添加密度曲线图和直方图交汇
> hist(Insurance$Claims,freq=FALSE,density = 20,
+ main= "Histrogrm of Densitry of Insurance$Clamis")
> lines(density(Insurance$Claims))
> hist(Insurance$Claims,freq=FALSE,density = 20,
+ main= "Histrogrm of Densitry of Insurance$Clamis")
> lines(density(Insurance$Claims))
由于原始数据没有在Age变量的各个水平下Claims的分布情况,因此我们需要计算在四个age阶段Claims的值,程序如下,其中用到了names.arg是命名的形式表示,标注出条形图中各矩形所对应的离散数值水平
> Claims_Age = with(Insurance,c(
+ sum(Claims[which(Age=="<25")]),
+ sum(Claims[which(Age=="25-29")]),
+ sum(Claims[which(Age=="30-35")]),
+ sum(Claims[which(Age==">35")])))
> Claims_Age
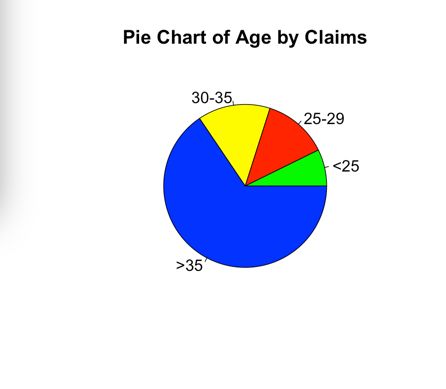
[1] 229 404 453 2065
> barplot(Claims_Age,names.arg = c("<25","25-29","30-35",">35"),density = rep(20,4),main = "Distribution of age by Claims", xlab = "Age", ylab = "Claims")
> barplot(Claims_Age,names.arg = c("<25","25-29","30-35",">35"),density = rep(30,4),main = "Distribution of age by Claims", xlab = "Age", ylab = "Claims")
同理统计Holders与Age的对应关系
> Holders_Age = with(Insurance,c(sum(Holders[which(Age=="<25")]),
+ sum(Holders[which(Age=="25-29")]),
+ sum(Holders[which(Age=="30-35")]),
+ sum(Holders[which(Age==">35")])))
> data_bar=rbind(Claims_Age,Holders_Age)
> data_bar
[,1] [,2] [,3] [,4]
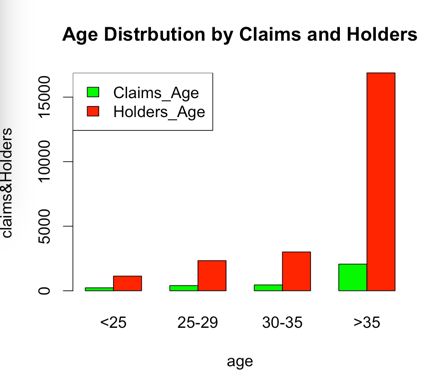
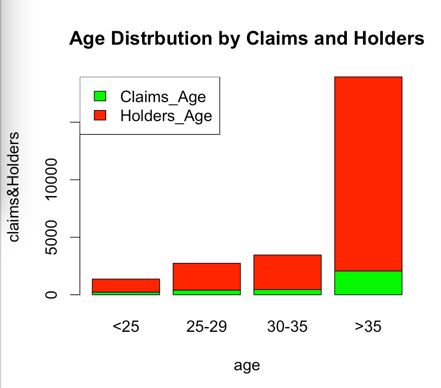
Claims_Age 229 404 453 2065
Holders_Age 1138 2336 3007 16878
绘制连体直方图将Holders—Age,Claims-Age进行绑定
> barplot(data_bar,names.arg = c("<25","25-29","30-35",">35"),
+ beside=TRUE,
+ main="Age Distrbution by Claims and Holders",
+ xlab="Age",ylab="Claims&Holders",col=c("red","green"))
绘制内嵌直方图将Holders—Age,Claims-Age进行绑定
> legend(x="topleft",rownames(data_bar),fill = c("red","green"))
> barplot(data_bar,names.arg = c("<25","25-29","30-35",">35"),
+ beside=FALSE,
+ main="Age Distrbution by Claims and Holders",
+ xlab="Age",ylab="Claims&Holders",col=c("red","green"))
> legend(x="topleft",rownames(data_bar),fill = c("red","green"))
绘制点阵图
> dotchart(data_bar,xlab = "Claims&Holders",pch = 1:2,
+ col=c("red","green"),
+ main="Age Distribution by Claims and Holders")
绘制饼图
> pie(Claims_Age,labels = c("<25","25-29","30-35",">35"),
+ main="Pie Chart of Age by Claims",
+ col=c("green","red","yellow","blue"))
绘制带百分比的饼图
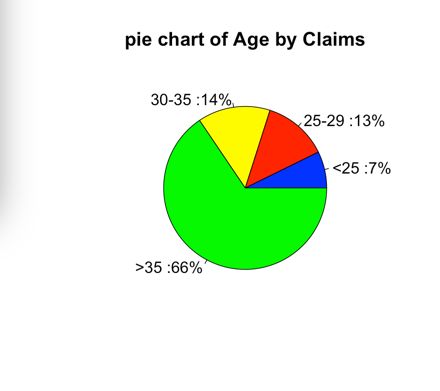
> percent=round(Claims_Age/sum(Claims_Age)*100)
> label=paste(paste(c("<25","25-29","30-35",">35"),":"),percent,"%",sep = "")
> pie(Claims_Age,labels = label,
+ main="pie chart of Age by Claims",col=c("blue","red","yellow","green"))
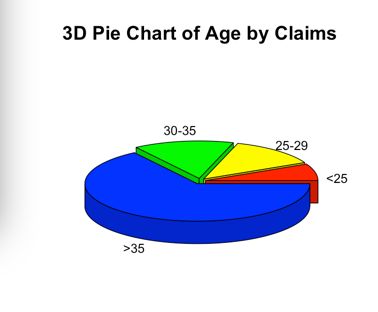
绘制3D饼图
> library(plotrix)
> pie3D(Claims_Age,labels = c("<25","25-29","30-35",">35"),explode = 0.05,
+ main="3D Pie Chart of Age by Claims",labelcex=0.8,
+ col=c("red","yellow","green","blue"))
