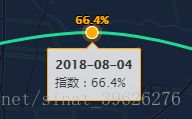
highchart 曲线点添加值,tooltip、y轴添加单位(更改文字颜色)
1. 改变曲线中每个点的颜色:在数据封装的时候,给每个数据点添加color属性,这个值即是点的颜色
2. 给每个点上添加当前坐标点的y轴的值:
plotOptions: {
      useHTML: true,
      series: {
        dataLabels: {
          enabled: true,
          color: 'rgba(255, 255, 255, 0.9)',
          // format: '{y}' + ytext,
          formatter() {
            // console.log(this);
            const str = `${this.point.y}${ytext}`; // ytext是传入的参数(单位)

            return str;
          }
        },
      }
    },
3. 提示框添加单位或者格式化时间
tooltip: {
useHTML: true,
dateTimeLabelFormats: {
millisecond: '%H:%M:%S.%L',
second: '%H:%M:%S',
minute: '%H:%M',
hour: '%m-%d %H:%M',
day: '%m-%d',
week: '%m-%d',
month: '%Y-%m',
year: '%Y'
},
formatter() {
const time = getFormatDate(new Date(this.x)).substr(0, 11);
let s = `${time}
`;
s += `指数:${this.y}${ytext}
`;
return s;
}
},4. 给y轴添加单位,单位可以是外部传进来的参数,也可以是本身写死的单位
    yAxis: {
      title: '',
      gridLineColor: 'transparent',
      labels: {
        style: {
          color: '#86BDB6',
          fontSize: fontSize
        },
        format: '{value}' + ytext
      },
    },

