DevExpress控件ChartControl简单案例
由于工作需要,最近学习了DevExpress控件中的ChartControl,并做了简单尝试,通过程序动态添加数据源到chartControl控件中,绘制了如下的条形图。
条形图的颜色等外观可在chartControl控件的RunWizard中编辑,也可以在RunWizard中添加静态的Series,并对条形图的各种属性进行设置。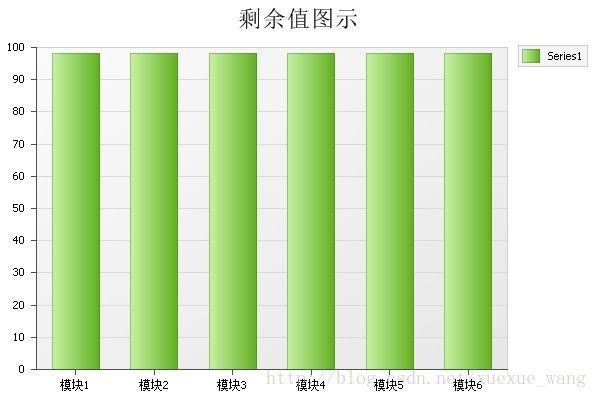
using System;
using System.Collections.Generic;using System.ComponentModel;
using System.Data;
using System.Drawing;
using System.Text;
using System.Windows.Forms;
using DevExpress.XtraEditors;
using DevExpress.XtraCharts;
namespace DXWindowsApplication1
{
public partial class Form4 : DevExpress.XtraEditors.XtraForm
{
public Form4()
{
InitializeComponent();
InitChartDataSource();
}
public void InitChartDataSource()
{
Series Series1 = new Series(" Series1", DevExpress.XtraCharts.ViewType.Bar);
Series1.DataSource = CreateDataSource();
Series1.ArgumentScaleType = ScaleType.Qualitative;
Series1.ArgumentDataMember = "模块名"; //以数据源的哪一行为参数
Series1.ValueScaleType = ScaleType.Numerical; //以数据的形式展示
Series1.ValueDataMembers.AddRange(new string[] { "剩余值" }); //需要展示的数据
chartControl1.Series.Add(Series1); //添加至chartControl1
XYDiagram diagram = (XYDiagram)chartControl1.Diagram; //获取chartControl的diagram对象
diagram.AxisY.MinorCount = 10; //设置Y轴的间隔
// diagram.AxisY.NumericOptions.Format = NumericFormat.Percent; //以百分数显示
diagram.AxisY.Range.MaxValueInternal = 100; //最大值为100
diagram.AxisY.Range.Auto = false; //不允许自动设定间隔值
diagram.AxisY.Range.MinValueInternal = 0; //最小值从0开始
diagram.AxisY.Tickmarks.MinorVisible = false; //不显示间隔标示符
diagram.AxisX.Tickmarks.MinorVisible = false;
ChartTitle ct = new ChartTitle(); //添加标题
ct.Text = "剩余值图示";
ct.TextColor = Color.Black;//颜色
ct.Font = new Font("Tahoma", 16);//字体
ct.Dock = ChartTitleDockStyle.Top;//停靠在上方
ct.Alignment = StringAlignment.Center;//居中显示
chartControl1.Titles.Add(ct);
}
public DataTable CreateDataSource()
{
DataTable Dt = new DataTable();
DataColumn column1 = new DataColumn();
column1.DataType = System.Type.GetType("System.String");
column1.ColumnName = "模块名";
column1.Caption = "模块名";
Dt.Columns.Add(column1);
DataColumn column2 = new DataColumn();
column2.DataType = System.Type.GetType("System.Double");
column2.ColumnName = "剩余值";
column2.Caption = "剩余值";
Dt.Columns.Add(column2);
DataRow row1 = chezhanDt.NewRow();
row1["模块名"] = "模块1";
row1["剩余值"] = 98;
Dt.Rows.Add(row1);
DataRow row2 = chezhanDt.NewRow();
row2["模块名"] = "模块2";
row2["剩余值"] = 98;
chezhanDt.Rows.Add(row2);
DataRow row3 = chezhanDt.NewRow();
row3["模块名"] = "模块3";
row3["剩余值"] = 99;
Dt.Rows.Add(row3);
DataRow row4 = chezhanDt.NewRow();
row4["模块名"] = "模块4";
row4["SPD模块剩余寿命百分比"] = 98;
Dt.Rows.Add(row4);
DataRow row5 = chezhanDt.NewRow();
row5["模块名"] = "模块5";
row5["剩余值"] = 98;
Dt.Rows.Add(row5);
DataRow row6 = chezhanDt.NewRow();
row6["模块名"] = "模块6";
row6["剩余值"] = 98;
Dt.Rows.Add(row6);
return Dt;
}
}
}