机器学习(回归四)——线性回归-正则化
上篇博客是针对普通线性回归往往存在欠拟合的情况,采用多项式扩展的方式,从而映射到多维空间来拟合。多项式扩展的时候,如果指定的阶数比较大,那么有可能导致过拟合。也就是模型太契合训练数据了。数据上表现就是参数过多、过大。过拟合在实际机器学习应用中是普遍存在的。
正则化的引入
对于前面提到的目标函数:
J ( θ ) = 1 2 ∑ i = 1 m ( h θ ( x ( i ) ) − y ( i ) ) 2 J{(\theta)} = \frac{1}{2} \sum_{i=1}^m \left( h_\theta \left(x^{(i)} \right) -y^{(i)} \right)^2 J(θ)=21i=1∑m(hθ(x(i))−y(i))2
现在,我们要防止过拟合,可以通过调节参数值,让参数越小越好。也可以说参数越小,模型越简单。比如说除了两个参数外,其他的参数都小到为0了,此时完全可以只关心这两个参数的情况了,从而从高维空间降到了低维空间。
为了防止数据过拟合,也就是的θ值在样本空间中不能过大/过小,可以在目标函数之上增加一个平方和损失:
J ( θ ) = 1 2 ∑ i = 1 m ( h θ ( x ( i ) ) − y ( i ) ) 2 + λ ∑ i = 1 m θ j 2 J{(\theta)} = \frac{1}{2} \sum_{i=1}^m \left( h_\theta \left(x^{(i)} \right) -y^{(i)} \right)^2 + \lambda \sum_{i=1}^m \bm{\theta}^2_j J(θ)=21i=1∑m(hθ(x(i))−y(i))2+λi=1∑mθj2
加上的这项后半部分,也可写成 θ T θ θ^T θ θTθ 或 ||θ||(也叫二范式)这就是正则项: λ ∑ i = 1 m θ j 2 \lambda \sum_{i=1}^m \bm{\theta}^2_j λ∑i=1mθj2 这里这个正则项叫做 L2-norm,有的地方也叫惩罚项,就是原始J(θ)的一个惩罚值。
两部分加在一起最小化,是我们要达到的目的。第一项是凸函数,第二项也是凸函数,而且是两个开口向上的凸的函数,叠加后还是凸函数。也就存在最小值,且在极值的位置,即求导为0的地方。最终求得的结果:
θ = ( X T X + λ I ) − 1 X T y \bm{\theta} = \left( X^T X + \lambda I \right)^{-1} X^T \bm{y} θ=(XTX+λI)−1XTy
是不是很熟悉?没错这就是《机器学习(回归一)——线性回归-最小二乘》中为了防止不可逆或者过拟合的问题存在,可以增加额外数据影响,使得最终的矩阵是可逆的,从而得到的式子。
常见线性回归正则化模型
故:为了解决过拟合问题,我们可以选择在损失函数中加入惩罚项(对于系统过磊的惩罚),主要分为L1-norm和L2-norm,以及他俩结合的线性回归模型:
- 使用L2正则的线性回归模型就称为Ridge回归(岭回归)
J ( θ ) = 1 2 ∑ i = 1 m ( h θ ( x ( i ) ) − y ( i ) ) 2 + λ ∑ i = 1 m θ j 2 λ > 0 J{(\theta)} = \frac{1}{2} \sum_{i=1}^m \left( h_\theta \left(x^{(i)} \right) -y^{(i)} \right)^2 + \lambda \sum_{i=1}^m \bm{\theta}^2_j \,\,\,\,\,\,\,\,\lambda>0 J(θ)=21i=1∑m(hθ(x(i))−y(i))2+λi=1∑mθj2λ>0 - 使用L1正则的线性回归模型就称为LASSO回归(Least Absolute Shrinkage and Selection Operator)
J ( θ ) = 1 2 ∑ i = 1 m ( h θ ( x ( i ) ) − y ( i ) ) 2 + λ ∑ i = 1 m ∣ θ j ∣ λ > 0 J{(\theta)} = \frac{1}{2} \sum_{i=1}^m \left( h_\theta \left(x^{(i)} \right) -y^{(i)} \right)^2 + \lambda \sum_{i=1}^m |\bm{\theta}_j | \,\,\,\,\,\,\,\,\lambda>0 J(θ)=21i=1∑m(hθ(x(i))−y(i))2+λi=1∑m∣θj∣λ>0 - 同时使用L1正则和L2正则的线性回归模型就称为 Elasitc Net 算法(弹性网络算法)
J ( θ ) = 1 2 ∑ i = 1 m ( h θ ( x ( i ) ) − y ( i ) ) 2 + λ ( p ∑ i = 1 m ∣ θ j ∣ + ( 1 − p ) ∑ i = 1 m θ j 2 ) { λ > 0 p ∈ [ 0 , 1 ] J{(\theta)} = \frac{1}{2} \sum_{i=1}^m \left( h_\theta \left(x^{(i)} \right) -y^{(i)} \right)^2 + \lambda \left( p\sum_{i=1}^m |\bm{\theta}_j | + (1-p)\sum_{i=1}^m \bm{\theta}^2_j\right) \,\,\,\,\,\,\,\, \begin{cases} \lambda>0 \\ p\in[0,1] \end{cases} J(θ)=21i=1∑m(hθ(x(i))−y(i))2+λ(pi=1∑m∣θj∣+(1−p)i=1∑mθj2){ λ>0p∈[0,1]
各种线性回归过拟合显示
这里自己手动生成数据,来看看各种不同的线性回归模型在过拟合时的显示效果。
import numpy as np
import matplotlib as mpl
import matplotlib.pyplot as plt
import pandas as pd
import warnings
import sklearn
from sklearn.linear_model import LinearRegression, LassoCV, RidgeCV, ElasticNetCV
from sklearn.preprocessing import PolynomialFeatures#数据预处理,标准化
from sklearn.pipeline import Pipeline
from sklearn.linear_model.coordinate_descent import ConvergenceWarning

## 设置字符集,防止中文乱码
mpl.rcParams['font.sans-serif']=[u'simHei']
mpl.rcParams['axes.unicode_minus']=False
## 拦截异常
warnings.filterwarnings(action = 'ignore', category=ConvergenceWarning)

## 创建模拟数据
np.random.seed(100)
np.set_printoptions(linewidth=1000, suppress=True)#显示方式设置,每行的字符数用于插入换行符,是否使用科学计数法
N = 10
x = np.linspace(0, 6, N) + np.random.randn(N)
y = 1.8*x**3 + x**2 - 14*x - 7 + np.random.randn(N)
## 将其设置为矩阵
x.shape = -1, 1
y.shape = -1, 1

## RidgeCV和Ridge的区别是:前者可以进行交叉验证
models = [
    Pipeline([
            ('Poly', PolynomialFeatures(include_bias=False)),
            ('Linear', LinearRegression(fit_intercept=False))
        ]),
    Pipeline([
            ('Poly', PolynomialFeatures(include_bias=False)),
            # alpha给定的是Ridge算法中,L2正则项的权重值,也就是ppt中的兰姆达
            # alphas是给定CV交叉验证过程中,Ridge算法的alpha参数值的取值的范围
            ('Linear', RidgeCV(alphas=np.logspace(-3,2,50), fit_intercept=False))
        ]),
    Pipeline([
            ('Poly', PolynomialFeatures(include_bias=False)),
            ('Linear', LassoCV(alphas=np.logspace(0,1,10), fit_intercept=False))
        ]),
    Pipeline([
            ('Poly', PolynomialFeatures(include_bias=False)),
            # la_ratio:给定EN算法中L1正则项在整个惩罚项中的比例,这里给定的是一个列表;
            # 表示的是在CV交叉验证的过程中,EN算法L1正则项的权重比例的可选值的范围
            ('Linear', ElasticNetCV(alphas=np.logspace(0,1,10), l1_ratio=[.1, .5, .7, .9, .95, 1], fit_intercept=False))
        ])
]

## 线性模型过拟合图形识别
plt.figure(facecolor='w')
degree = np.arange(1,N,4) # 阶
dm = degree.size
colors = [] # 颜色
for c in np.linspace(16711680, 255, dm):
    colors.append('#%06x' % int(c))

model = models[0]
for i,d in enumerate(degree):
    plt.subplot(int(np.ceil(dm/2.0)),2,i+1)
    plt.plot(x, y, 'ro', ms=10, zorder=N)

    # 设置阶数
    model.set_params(Poly__degree=d)
    # 模型训练
    model.fit(x, y.ravel())

    lin = model.get_params('Linear')['Linear']
    output = u'%d阶,系数为:' % (d)
    # 判断lin对象中是否有对应的属性
    if hasattr(lin, 'alpha_'):
        idx = output.find(u'系数')
        output = output[:idx] + (u'alpha=%.6f, ' % lin.alpha_) + output[idx:]
    if hasattr(lin, 'l1_ratio_'):
        idx = output.find(u'系数')
        output = output[:idx] + (u'l1_ratio=%.6f, ' % lin.l1_ratio_) + output[idx:]
    print (output, lin.coef_.ravel())

    x_hat = np.linspace(x.min(), x.max(), num=100) ## 产生模拟数据
    x_hat.shape = -1,1
    y_hat = model.predict(x_hat)
    s = model.score(x, y)

    z = N - 1 if (d == 2) else 0
    label = u'%d阶, 正确率=%.3f' % (d,s)
    plt.plot(x_hat, y_hat, color=colors[i], lw=2, alpha=0.75, label=label, zorder=z)

    plt.legend(loc = 'upper left')
    plt.grid(True)
    plt.xlabel('X', fontsize=16)
    plt.ylabel('Y', fontsize=16)

plt.tight_layout(1, rect=(0,0,1,0.95))
plt.suptitle(u'线性回归过拟合显示', fontsize=22)
plt.show()
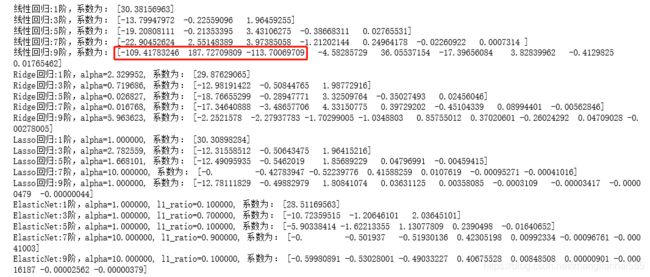
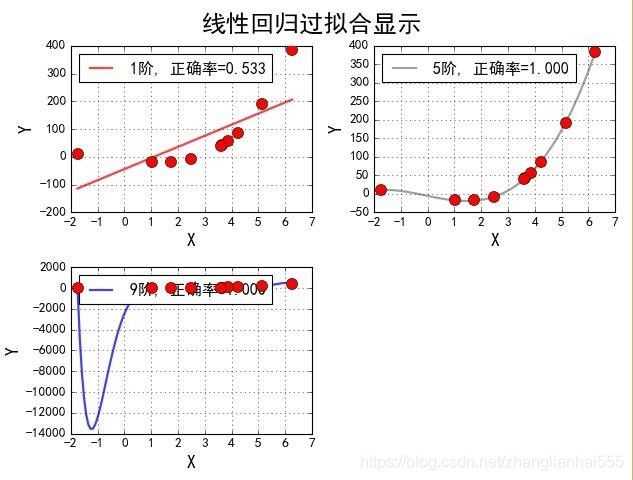
看一下不同阶数时的参数及效果图:
1阶,系数为: [30.38156963]
5阶,系数为: [-19.20808111 -0.21353395 3.43106275 -0.38668311 0.02765531]
9阶,系数为: [-109.41783246 187.72709809 -113.70069709 -4.58285729 36.05537154 -17.39656084 3.82839962 -0.4129825 0.01765462]
## 线性回归、Lasso回归、Ridge回归、ElasticNet比较
plt.figure(facecolor='w')
degree = np.arange(1,N, 2) # 阶, 多项式扩展允许给定的阶数
dm = degree.size
colors = [] # 颜色
for c in np.linspace(16711680, 255, dm):
    colors.append('#%06x' % int(c))
titles = [u'线性回归', u'Ridge回归', u'Lasso回归', u'ElasticNet']

for t in range(4):
    model = models[t]#选择了模型--具体的pipeline(线性、Lasso、Ridge、EN)
    plt.subplot(2,2,t+1) # 选择具体的子图
    plt.plot(x, y, 'ro', ms=10, zorder=N) # 在子图中画原始数据点; zorder:图像显示在第几层

    # 遍历不同的多项式的阶,看不同阶的情况下,模型的效果
    for i,d in enumerate(degree):
        # 设置阶数(多项式)
        model.set_params(Poly__degree=d)
        # 模型训练
        model.fit(x, y.ravel())

        # 获取得到具体的算法模型
        # model.get_params()方法返回的其实是一个dict对象,后面的Linear其实是dict对应的key
        # 也是我们在定义Pipeline的时候给定的一个名称值
        lin = model.get_params()['Linear']
        # 打印数据
        output = u'%s:%d阶,系数为:' % (titles[t],d)
        # 判断lin对象中是否有对应的属性
        if hasattr(lin, 'alpha_'): # 判断lin这个模型中是否有alpha_这个属性
            idx = output.find(u'系数')
            output = output[:idx] + (u'alpha=%.6f, ' % lin.alpha_) + output[idx:]
        if hasattr(lin, 'l1_ratio_'): # 判断lin这个模型中是否有l1_ratio_这个属性
            idx = output.find(u'系数')
            output = output[:idx] + (u'l1_ratio=%.6f, ' % lin.l1_ratio_) + output[idx:]
        # line.coef_:获取线性模型的参数列表,也就是我们ppt中的theta值,ravel()将结果转换为1维数据
        print (output, lin.coef_.ravel())

        # 产生模拟数据
        x_hat = np.linspace(x.min(), x.max(), num=100) ## 产生模拟数据
        x_hat.shape = -1,1
        # 数据预测
        y_hat = model.predict(x_hat)
        # 计算准确率
        s = model.score(x, y)

        # 当d等于5的时候,设置为N-1层,其它设置0层;将d=5的这条线凸显出来
        z = N + 1 if (d == 5) else 0
        label = u'%d阶, 正确率=%.3f' % (d,s)
        plt.plot(x_hat, y_hat, color=colors[i], lw=2, alpha=0.75, label=label, zorder=z)

    plt.legend(loc = 'upper left')
    plt.grid(True)
    plt.title(titles[t])
    plt.xlabel('X', fontsize=16)
    plt.ylabel('Y', fontsize=16)
plt.tight_layout(1, rect=(0,0,1,0.95))
plt.suptitle(u'各种不同线性回归过拟合显示', fontsize=22)
plt.show()
代码看着挺多,其实主要是画图。再看一下运行效果及参数:


发现:到三阶的时候,都拟合的特别好,但是到九阶时,普通的线性回归,出了明显的拐线。普通回归,到9阶时,有多个比较大的系数,而其他的没有出现这个情况;Lasso在高阶时,出现了好多非常接近0的系数。
L1正则与L2正则对比
-
L2-norm中,由于对于各个维度的参数缩放是在一个圆内缩放的,不可能导致有维度参数变为0的情况,那么也就不会产生稀疏解;实际应用中,数据的维度中是存在噪音和冗余的,稀疏的解可以找到有用的维度并且减少冗余,提高回归预测的准确性和鲁棒性(减少了overfitting)(L1-norm可以达到最终解的稀疏性的要求);
-
Ridge模型具有较高的准确性、鲁棒性以及稳定性;LASSO模型具有较高的求解速度。(等于0的参数,我们就可以不用考虑,这个过程叫特征选择);
-
如果既要考虑稳定性也考虑求解的速度,就使用Elasitc Net。
以两个参数为例,第一二个参数分别为横纵坐标,到原点小于等t的图形,分别是两个阴影部分。(左图是L1,右图是L2)J(θ)类似于一个椭圆(ax² + by²=c)。
在上图中就是一圈的椭圆线,等高线,椭圆上的值是相等的。中间的那个点是最优的解。
加上惩罚项过,最优,就是交点处。图1,交点,可以在坐标轴上,即参数可能出现0的情况。但图2就不行。
总结:
普通的线性回归往往拟合效果不好,比如图形是曲线的形式,可以做一个多项式扩展,变到高维空间。也可以说多项式扩展能解决线性回归模型欠拟合的情况。但多项式的阶数如果太高,就会导致过拟合的情况,也就是训练集上特别好,测试集不太理想。
对于过拟合可以使用L1或L2来解决,也就是在J(θ) 的基础上把模型的复杂度加上,如岭回归。
在线性回归中,可以理解为就是θ值,我们把θ值加上去,但值有正有负所以出现了常用的两种形式:L1 L2,并引入超参λ来进行调整

