一元一次
导包
import numpy as np

import matplotlib.pyplot as plt
%matplotlib inline

from sklearn.linear_model import LinearRegression
创建数据
X = np.linspace(2,10,20).reshape(-1,1)
y = np.random.randint(1,6,size = 1)*X + np.random.randint(-5,5,size = 1)
y += np.random.randn(20,1)*0.8
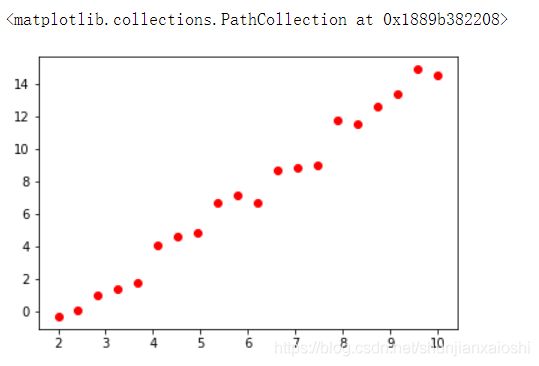
plt.scatter(X,y,color = 'red')
使用已有的线性回归拟合函数
lr = LinearRegression()
lr.fit(X,y)

w = lr.coef_[0,0]
b = lr.intercept_[0]
print(w,b)

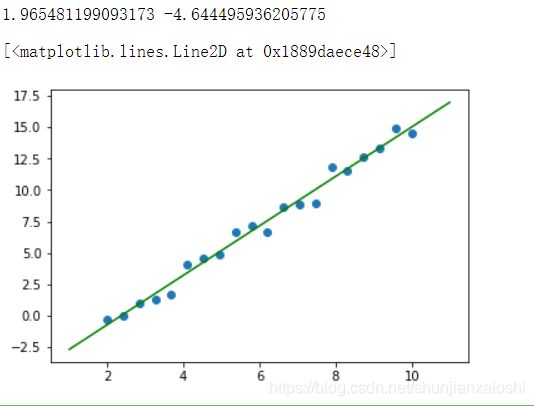
plt.scatter(X,y)

x = np.linspace(1,11,50)

plt.plot(x,w*x + b,color = 'green')
自己实现了线性回归(简版)
class LinearModel(object):
def __init__(self):
self.w = np.random.randn(1)[0]
self.b = np.random.randn(1)[0]
def model(self,x):
return self.w*x + self.b
def loss(self,x,y):
cost = (y - self.model(x))**2
gradient_w = 2*(y - self.model(x))*(-x)
gradient_b = 2*(y - self.model(x))*(-1)
return cost,gradient_w,gradient_b
def gradient_descent(self,gradient_w,gradient_b,learning_rate = 0.1):
self.w -= gradient_w*learning_rate
self.b -= gradient_b*learning_rate
def fit(self,X,y):
count = 0
tol = 0.0001
last_w = self.w + 0.1
last_b = self.b + 0.1
length = len(X)
while True:
if count > 3000:
break
if (abs(last_w - self.w) < tol) and (abs(last_b - self.b) < tol):
break
cost = 0
gradient_w = 0
gradient_b = 0
for i in range(length):
cost_,gradient_w_,gradient_b_ = self.loss(X[i,0],y[i,0])
cost += cost_/length
gradient_w += gradient_w_/length
gradient_b += gradient_b_/length
last_w = self.w
last_b = self.b
self.gradient_descent(gradient_w,gradient_b,0.01)
count+=1
def result(self):
return self.w,self.b
使用自己实现的线性回归拟合函数
lm = LinearModel()

lm.fit(X,y)

w_,b_ = lm.result()

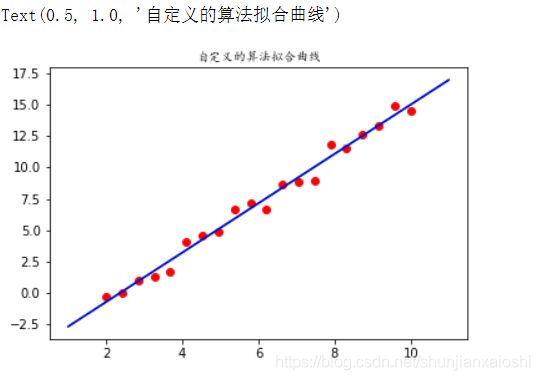
plt.scatter(X,y,c = 'red')

plt.plot(x,1.9649*x - 4.64088,color = 'green')

plt.plot(x,w*x + b,color = 'blue')

plt.title('自定义的算法拟合曲线',fontproperties = 'KaiTi')
一元二次
import numpy as np
import matplotlib.pyplot as plt
%matplotlib inline
from sklearn.linear_model import LinearRegression
X = np.linspace(0,10,num = 500).reshape(-1,1)
X = np.concatenate([X**2,X],axis = 1)
X.shape
w = np.random.randint(1,10,size = 2)
b = np.random.randint(-5,5,size = 1)
y = X.dot(w) + b
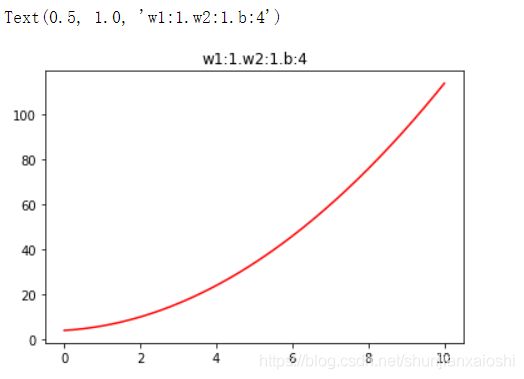
plt.plot(X[:,1],y,color = 'r')
plt.title('w1:%d.w2:%d.b:%d'%(w[0],w[1],b[0]))
使用sklearn自带的算法,预测
lr = LinearRegression()

lr.fit(X,y)

print(lr.coef_,lr.intercept_)

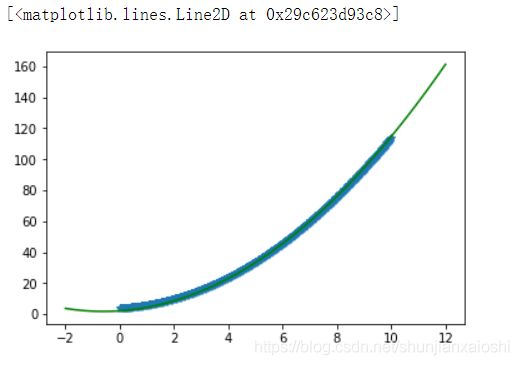
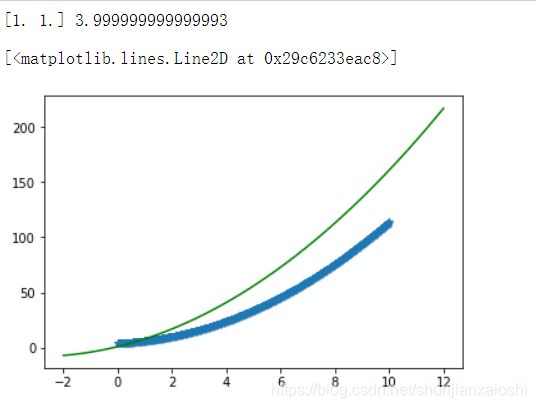
plt.scatter(X[:,1],y,marker = '*')

x = np.linspace(-2,12,100)

plt.plot(x,1*x**2 + 6*x + 1,color = 'green')
自己手写的线性回归,拟合多属性,多元方程
def gradient_descent(X,y,lr,epoch,w,b):
batch = len(X)
for i in range(epoch):
d_loss = 0
dw = [0 for _ in range(len(w))]
db = 0
for j in range(batch):
y_ = 0
for n in range(len(w)):
y_ += X[j][n]*w[n]
y_ += b
d_loss = -(y[j] - y_)
for n in range(len(w)):
dw[n] += X[j][n]*d_loss/float(batch)
db += 1*d_loss/float(batch)
for n in range(len(w)):
w[n] -= dw[n]*lr[n]
b -= db*lr[0]
return w,b
lr = [0.0001,0.0001]
w = np.random.randn(2)
b = np.random.randn(1)[0]
w_,b_ = gradient_descent(X,y,lr,5000,w,b)
print(w_,b_)
plt.scatter(X[:,1],y,marker = '*')
x = np.linspace(-2,12,100)
f = lambda x:w_[0]*x**2 + w_[1]*x + b_
plt.plot(x,f(x),color = 'green')
