seaborn 热图_Seaborn热图教程–综合指南
seaborn 热图
Hey, folks! In this article, we will be discussing about Data Visualization through Seaborn Heatmaps.
嘿伙计! 在本文中,我们将讨论通过Seaborn Heatmaps进行数据可视化 。
了解Seaborn库中的热图 (Understanding Heatmap in Seaborn library)
Python has got various modules to prepare and present the data in a visualized form for a better understanding of the built data model.
Python提供了各种模块来以可视化的形式准备和呈现数据,以更好地理解所构建的数据模型。
Python Seaborn module is used to visualize the data and explore various aspects of the data in a graphical format. It is built on top of the Python Matplotlib module which too serves functions to plot the data in a varied manner.
Python Seaborn模块用于可视化数据并以图形格式浏览数据的各个方面。 它建立在Python Matplotlib模块之上,该模块也提供了以多种方式绘制数据的功能。
Seaborn cannot be considered as an alternative to Matplotlib, but indeed can be considered as a helping feature in data exploration and visualization.
Seaborn不能被视为Matplotlib的替代品,但实际上可以被视为数据探索和可视化的辅助功能。
Seaborn has multiple built-in functions to build graphs for data visualization. One of the important functions in the direction of Data exploration and visualization is HeatMaps.
Seaborn具有多个内置功能来构建用于数据可视化的图形。 HeatMaps是数据探索和可视化方向上的重要功能之一。
Seaborn Heatmaps represent the data in the form of a 2-dimensional format. Heatmaps visualize the data and represent in the form of a summary through the graph/colored maps.
Seaborn 热图以二维格式表示数据。 热图使数据可视化,并通过图形/彩色图以摘要的形式表示。
It uses various color palettes and different parameters to add more visualization features to the graph and thus adds to exploration of data effectively.
它使用各种调色板和不同的参数为图形添加更多的可视化功能,从而有效地增加了对数据的探索。
In order to get started with Heatmaps, we need to install the Seaborn module using the below syntax–
为了开始使用Heatmaps,我们需要使用以下语法安装Seaborn模块–
Syntax:
句法:
pip install seaborn
Seaborn requires the following modules to be installed in a prior manner:
Seaborn要求事先安装以下模块:
- Pandas 大熊猫
- NumPy NumPy
- Matplotlib Matplotlib
1.创建一个热图 (1. Creating a HeatMap)
Let’s create a basic Heatmap with the following syntax to create a visualization graph of the data provided to it.
让我们使用以下语法创建基本的Heatmap ,以创建提供给它的数据的可视化图。
Syntax:
句法:
seaborn.heatmap(data)
Example:
例:
import numpy as np
import seaborn as sn
import matplotlib.pyplot as plt
data_plot = np.random.rand(6,5)
map = sn.heatmap(data_plot)
plt.show()
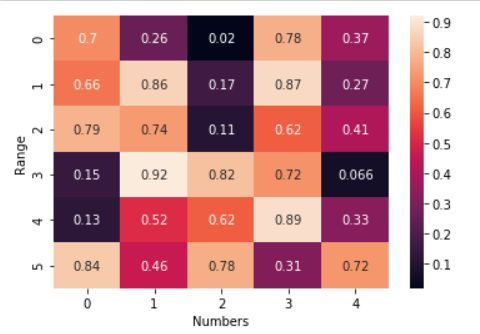
In the above snippet of code, we have used numpy.random.rand(m,n) function to randomly generate some data with 6 rows and 5 columns to be fed to the heatmap. Further, pyplot.show() function is used to represent the heatmap with proper formatting.
在上面的代码片段中,我们使用了numpy.random.rand(m,n) function来随机生成一些数据,这些数据有6行5列要馈入热图。 此外, pyplot.show() function用于以正确的格式表示热图。
Output:
输出:
2.删除HeatMap中的标签 (2. Remove labels in the HeatMap)
As seen in the above Heatmap representation, the values/data points represented by x-axis and y-axis is known as tick labels. They represent the scale of the data plotted and visualized using the Heatmaps.
从上面的热图表示中可以看出,由x轴和y轴表示的值/数据点被称为刻度标签。 它们代表使用热图绘制和可视化的数据的比例。
The tick labels are of the following types-
勾号标签具有以下类型:
- x-tick labels X-tick标签
- y-tick labels y-tick标签
从HeatMap移除y标签 (Removing y-label from a HeatMap)
By default, the tick labels are present in the Heatmaps. In order to remove the y-tick, we can use the below syntax:
默认情况下,刻度标签出现在热图中。 为了删除y-tick,我们可以使用以下语法:
seaborn.heatmap(data,yticklabels=False)
Example:
例:
import numpy as np
import seaborn as sn
import matplotlib.pyplot as plt
data_plot = np.random.rand(6,5)
map = sn.heatmap(data_plot,yticklabels=False)
plt.show()
Output:
输出:
从HeatMap移除x标签 (Removing x-label from a HeatMap)
To remove the x-tick label scale, use the below syntax:
要删除x-tick标签刻度,请使用以下语法:
seaborn.heatmap(data,xticklabels=False)
Example:
例:
import numpy as np
import seaborn as sn
import matplotlib.pyplot as plt
data_plot = np.random.rand(6,5)
map = sn.heatmap(data_plot,xticklabels=False)
plt.show()
Output:
输出:
3.在HeatMap中设置标签 (3. Setting labels in HeatMap)
For adding better value and understanding to the Heatmap, it is possible to add labels that would contribute to adding more meaning in understanding the visualized data.
为了给热图增加更好的价值和理解,可以添加有助于在理解可视化数据方面增加更多含义的标签。
1.设置x标签 (1. Set x-label)
The following syntax can be used to add a text label to the x-tick axis using matplotlib in-built function:
使用matplotlib内置函数,可以使用以下语法将文本标签添加到x-tick轴:
pyplot.xlabel("label")
Example:
例:
import numpy as np
import seaborn as sn
import matplotlib.pyplot as plt
data_plot = np.random.rand(6,5)
map = sn.heatmap(data_plot)
plt.xlabel("Numbers")
plt.show()
Output:
输出:
2.设置y-label (2. Set y-label)
In a similar manner, the following syntax can be inculcated to add a text label to the y-tick axis:
以类似的方式,可以灌输以下语法以将文本标签添加到y-tick轴:
pyplot.ylabel("label")
Example:
例:
import numpy as np
import seaborn as sn
import matplotlib.pyplot as plt
data_plot = np.random.rand(6,5)
map = sn.heatmap(data_plot)
plt.ylabel("Range")
plt.show()
Output:
输出:
4.将文本值添加到HeatMap (4. Adding text values to the HeatMap)
We can add the values represented by the 2-dimensional format of Heatmap that would add value to the better understanding of the represented data using the below syntax:
我们可以使用以下语法添加由Heatmap的二维格式表示的值,该值将为更好地理解表示的数据增加价值:
seaborn.heatmap(data,annot=True)
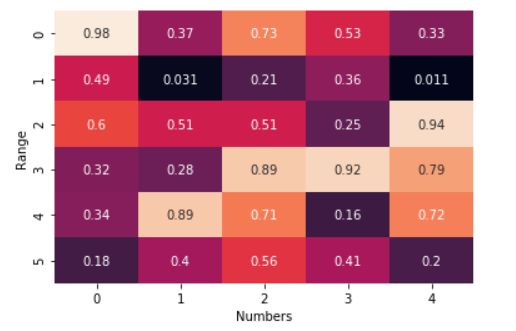
The annot parameter is set to True, to display the data plotted by the heatmap.
annot parameter设置为True ,以显示由热图绘制的数据。
Example 1: Adding text values to the randomly generated data using Heatmaps
示例1:使用热图将文本值添加到随机生成的数据
import numpy as np
import seaborn as sn
import matplotlib.pyplot as plt

data_plot = np.random.rand(6,5)

map = sn.heatmap(data_plot,annot=True)

plt.xlabel("Numbers")
plt.ylabel("Range")
plt.show()
Output:
输出:
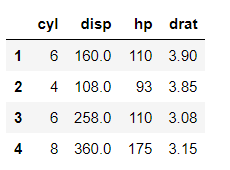
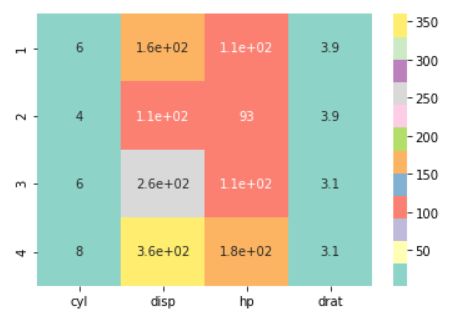
Example 2: Adding the data values from the dataset to represent in the Heatmap
示例2:从数据集中添加数据值以在热图中表示
import pandas as pd
import seaborn as sn
import matplotlib.pyplot as plt

data = pd.read_csv("C:/Python_edwisor/mtcars.csv")
data_set = pd.DataFrame(data.iloc[1:5,1:5])
map = sn.heatmap(data_set,annot=True)
plt.show()
Input Dataset:
输入数据集:
Output:
输出:
5. Seaborn HeatMaps中的ColorMaps (5. ColorMaps in Seaborn HeatMaps)
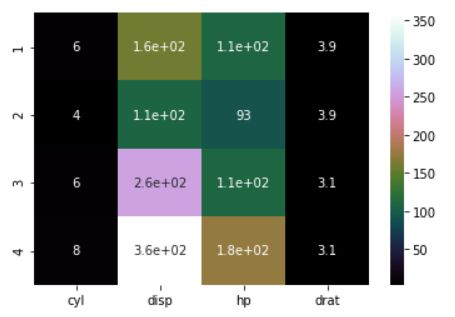
The Colormap helps understand the data presented by the Heatmaps effectively. Colormaps represent the distribution of the data wherein we can analyze the data in terms of the minimum and maximum values represented by the colors from the colorbar.
彩色图有助于有效地了解热图所显示的数据。 色图表示数据的分布,其中我们可以根据色条中颜色表示的最小值和最大值来分析数据。
1.顺序色图 (1. Sequential colormaps)
Sequential colormaps are used when the data experiences gradual and linear rise in the values of the data/population. Thus, sequential colormaps can be used to represent the linear rise from low to high values, respectively.
当数据经历数据/人口值的逐渐线性增长时,将使用顺序色图。 因此,顺序色图可分别用于表示从低值到高值的线性上升。
We can implement the sequential colormap by setting the cmap attribute to ‘cubehelix‘
我们可以通过将cmap attribute设置为' cubehelix '来实现顺序颜色图
Syntax:
句法:
seaborn.heatmap(data,cmap='cubehelix')
Example:
例:
import pandas as pd
import seaborn as sn
import matplotlib.pyplot as plt

data = pd.read_csv("C:/Python_edwisor/mtcars.csv")
data_set = pd.DataFrame(data.iloc[1:5,1:5])

map = sn.heatmap(data_set,annot=True,cmap="cubehelix")
plt.show()
Output:
输出:
2.不同的调色板 (2. Diverging color palette)
Diverging color palette creates a colormap as a combination of divergence between two colors.
发散 调色板创建一个颜色图,作为两种颜色之间发散的组合。
Syntax:
句法:
cmap = seaborn.diverging_palette(h_neg and h_pos, sep=value, l=value, as_cmap=True)
h_neg and h_pos: The values for negative and positive extends of the map. Ranges between 0-359.h_neg and h_pos:地图的负向和正向延伸值。 范围介于0-359之间。l: It is used to add lightness to both the extents of the map. Ranges between 0-100.l:用于在地图的两个范围内增加亮度。 范围介于0到100之间。sep: The sep parameter represents the size of the intermediate region of data in the heatmap.sep:sep参数表示热图中数据中间区域的大小。as_cmap: A boolean parameter, when set to True, it represents a matplotlib colormap object.as_cmap:一个布尔参数,当设置为True时,它表示一个matplotlib颜色图对象。
Example:
例:
import pandas as pd
import seaborn as sn
import matplotlib.pyplot as plt

data = pd.read_csv("C:/Python_edwisor/mtcars.csv")
data_set = pd.DataFrame(data.iloc[1:5,1:5])
cmap = sn.diverging_palette(320, 40, sep=40, as_cmap=True)
map = sn.heatmap(data_set,annot=True,cmap=cmap)
plt.show()
Output:
输出:
3.浅色和深色调色板colorMap (3. Light and Dark palette colorMap)
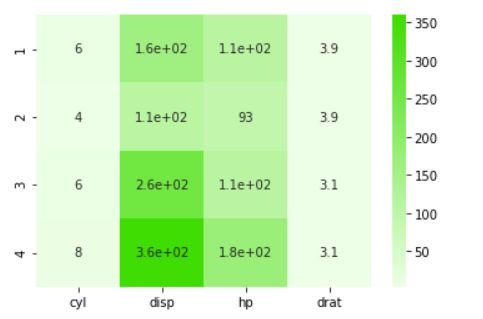
Using seaborn heatmaps, we can obtain a colormap with a blend of either light or dark values to visualize the data in a better manner.
使用seaborn热图,我们可以获得混合了亮或暗值的色图,以更好的方式可视化数据。
Types of blending colormap:
混合色图的类型:
Light palette colormap: It blends the given color from light to dark, representing the data from low to high values of the population.Light palette colormap:它将给定的颜色从浅到深混合 ,代表从低到高的总体数据。Dark palette colormap: It blends the given color from dark to light, representing the data from low to high values.Dark palette colormap:它将给定的颜色从暗到亮混合 ,代表从低到高的数据。
Syntax: Light palette
语法:调色板
cmap = seaborn.light_palette("color-code",as_cmap=True)
Example 1: Light palette
示例1:调色板
import pandas as pd
import seaborn as sn
import matplotlib.pyplot as plt

data = pd.read_csv("C:/Python_edwisor/mtcars.csv")
data_set = pd.DataFrame(data.iloc[1:5,1:5])
cmap = sn.light_palette("#3fdd01", as_cmap=True)
map = sn.heatmap(data_set,annot=True,cmap=cmap)
plt.show()
Output:
输出:
Syntax: Dark palette
语法:深色调色板
seaborn.dark_palette("color-code",as_cmap=True)
Example 2: Dark palette
示例2:深色调色板
import pandas as pd
import seaborn as sn
import matplotlib.pyplot as plt

data = pd.read_csv("C:/Python_edwisor/mtcars.csv")
data_set = pd.DataFrame(data.iloc[1:5,1:5])
cmap = sn.dark_palette("#3fdd01", as_cmap=True)
map = sn.heatmap(data_set,annot=True,cmap=cmap)
plt.show()
Output:
输出:
4.离散ColorMap (4. Discrete ColorMap)
If the dataset/population contains discrete data values, we can use the seaborn.mpl_palette() function to represent the discrete values with discrete colors.
如果数据集/人口包含离散的数据值,我们可以使用seaborn.mpl_palette() function以离散的颜色表示离散值。
Syntax:
句法:
seaborn.mpl_palette("Set3",value)
Set3: It is the name of the color palette (play around with other colormaps here)Set3:这是调色板的名称(在此处与其他颜色图一起使用 )value: Number of discrete colors to be presented in a palette.value:调色板中要显示的离散颜色数。
Example:
例:
import pandas as pd
import seaborn as sn
import matplotlib.pyplot as plt

data = pd.read_csv("C:/Python_edwisor/mtcars.csv")
data_set = pd.DataFrame(data.iloc[1:5,1:5])
cmap = sn.mpl_palette("Set3", 20)
map = sn.heatmap(data_set,annot=True,cmap=cmap)
plt.show()
Output:
输出:
6. Seaborn HeatMap颜色条 (6. Seaborn HeatMap colorbar)
The Colorbar gives information about the color represented by the visualized data and also represents the range of values that depicts the data plotted by the Heatmaps.
彩条提供有关可视化数据表示的颜色的信息,还表示描述热图绘制的数据的值范围。
By default, a colorbar is present in the Heatmap. If we wish to remove the colorbar from the heatmap, the below syntax can help you out with it:
默认情况下,热图中会显示一个颜色栏。 如果我们希望从热图中删除颜色条,则以下语法可以帮助您解决该问题:
seaborn.heatmap(data,cbar=False)
Example 1:
范例1:
import numpy as np
import seaborn as sn
import matplotlib.pyplot as plt

data_plot = np.random.rand(6,5)
map = sn.heatmap(data_plot,annot=True,cbar=False)

plt.xlabel("Numbers")
plt.ylabel("Range")
plt.show()
Output:
输出:
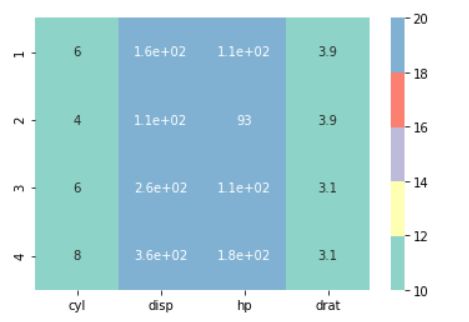
We can customize the Heatmap by providing the range to the scale of values represented by the colors of the colorbar using the below syntax:
我们可以使用以下语法,通过提供由颜色条的颜色表示的值的比例尺范围来自定义热图:
seaborn.heatmap(data,cmap,vmin=value,vmax=value)
Example 2:
范例2:
import pandas as pd
import seaborn as sn
import matplotlib.pyplot as plt

data = pd.read_csv("C:/Python_edwisor/mtcars.csv")
data_set = pd.DataFrame(data.iloc[1:5,1:5])
cmap = sn.mpl_palette("Set3", 5)
map = sn.heatmap(data_set,annot=True,cmap=cmap,vmin=10, vmax=20)

plt.show()
In the above example, we have set the scale of the colorbar from 10-20.
在上面的示例中,我们将颜色条的比例设置为10-20。
Output:
输出:
结论 (Conclusion)
Thus, in this article, we have understood the functioning of Seaborn Heatmaps.
因此,在本文中,我们了解了Seaborn Heatmaps的功能。
I strongly recommend you to go through Python Matplotlib module for deep understanding of Data Visualization.
我强烈建议您通过Python Matplotlib模块深入了解数据可视化。
参考资料 (References)
- Python Seaborn Tutorial — AskPython Python Seaborn教程— AskPython
- Seaborn Heatmaps — Official Documentation Seaborn热图-官方文档
翻译自: https://www.journaldev.com/38954/seaborn-heatmap-tutorial
seaborn 热图


