Python数据分析--数据可视化
数据可视化
- 建立画布
- 建立坐标系
-
- add_subplot 函数建立坐标系
- plt.subplot2grid 函数建议坐标系
- plt.subplot 函数建立坐标系
- plt.subplots 函数建立坐标系
- 设置坐标轴
-
- 设置坐标轴的标题
- 设置坐标轴的刻度
- 设置坐标轴范围
- 图表格式的设置
-
- 网格线设置
- 设置图例
- 图表标题设置
- 设置数据标签
- 图表注释
建立画布
# 导入matplotlib库中的pyplot并命名为plt
import matplotlib.pyplot as plt
# 让图表直接在Jupyter Notebook中展示出来
%matplotlib inline
# 解决中文乱码问题
plt.rcParams['font.sans-serif'] = ['Arial Unicode MS']  # Mac下字体Arial Unicode MS
# 解决负号无法正常显示问题
plt.rcParams['axes.unicode_minus'] = False
%config InlineBackend.figure_format = 'svg'
# 建立默认尺寸画布
fig = plt.figure()
>>>


# 建立宽8高6的画布
fig = plt.figure(figsize = (8,6))
>>>
- 注:画布不会直接显示,只会输出一串画布相关信息的代码
建立坐标系
add_subplot 函数建立坐标系
# 先绘制画布
# 绘制2X2个坐标,即4个坐标系
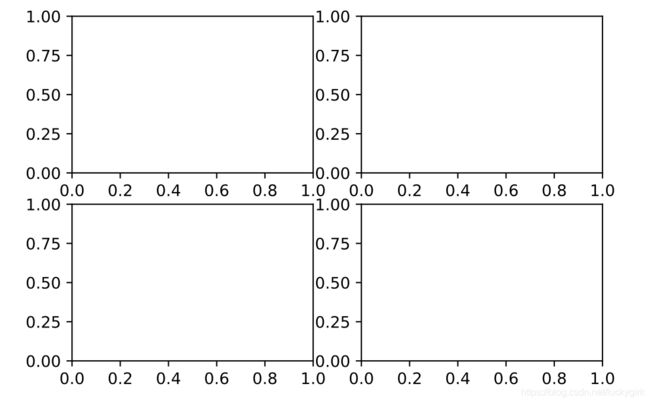
fig = plt.figure()
ax1 = fig.add_subplot(2,2,1)
ax2 = fig.add_subplot(2,2,2)
ax3 = fig.add_subplot(2,2,3)
ax4 = fig.add_subplot(2,2,4)
plt.subplot2grid 函数建议坐标系
不需要绘制画布,直接导入plt库调用subplot2grid函数
#将图表整个区域分成2行2列,且在(0,0)位置绘图
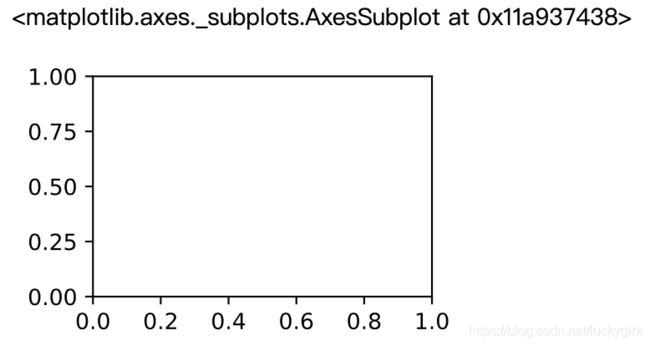
plt.subplot2grid((2,2),(0,0))
plt.subplot 函数建立坐标系
不需要绘制画布,直接导入plt库调用subplot函数
# 将图表整个区域分成2行2列,且在第1个坐标系绘图
plt.subplot(2,2,1)
plt.subplots 函数建立坐标系
subplots函数一次可以返回多个坐标系
# 将图表的整个区域分成2行2列,并将4个坐标系全部返回
fig,axes = plt.subplots(2,2)
设置坐标轴
设置坐标轴的标题
# 设置标题到坐标轴的距离 10
plt.xlabel('月份',labelpad = 10)
plt.ylabel('注册量',labelpad = 10)
# 设置标题的字体大小、颜色、是否加粗
plt.xlabel('月份',fontsize = 'xx-large',color = '#70AD47',fontweight = 'bold')
plt.ylabel('注册量')
设置坐标轴的刻度
# ticks 表示刻度值,labels 表示该刻度处对应的标签
plt.xticks(ticks,labels)
plt.yticks(ticks,labels)
import numpy as np
# 设置x轴刻度
plt.xticks(np.arange(9),['1月份','2月份','3月份','4月份','5月份','6月份','7月份','8月份','9月份'])
# 设置y轴刻度
plt.yticks(np.arange(1000,7000,1000),['1000人','2000人','3000人','4000人','5000人','6000人','7000人','8000人','9000人'])
# 将x/y轴的数值隐藏起来
plt.xticks([])
plt.yticks([])
设置坐标轴范围
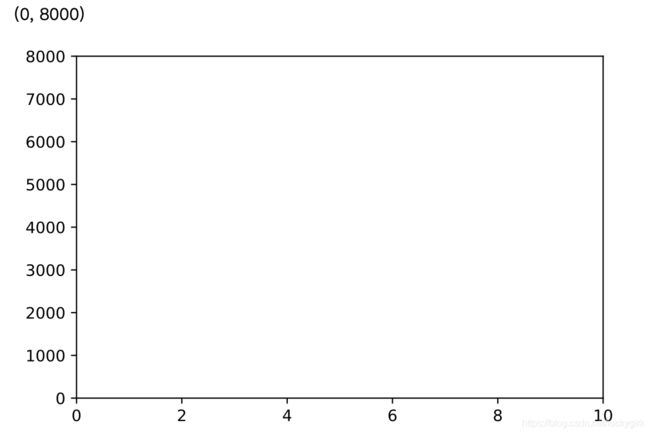
plt.xlim(0,10)
plt.ylim(0,8000)
# 不显示坐标轴
plt.axis('off')
图表格式的设置
网格线设置
网格线默认是关闭的
# x轴、y轴的网格线全部打开
plt.grid(b = 'True')
# 只打开x轴的网格线
plt.grid(b = 'True',axis = 'x')
# 只打开y轴的网格线
plt.grid(b = 'True',axis = 'y')
设置图例
# 图例默认显示1列
plt.plot(x,y,lable = '折线图')
plt.bar(x,y,lable = '柱形图')
plt.legend()

 # 显示2列图例
plt.plot(x,y,lable = '折线图')
plt.bar(x,y,lable = '柱形图')
plt.legend(ncol = 2)

# 设置图例显示位置
plt.plot(x,y,lable = '折线图')
plt.bar(x,y,lable = '柱形图')
plt.legend(loc = 2)
loc参数值说明:
| 字符串 | 位置代码 | 说明 |
|---|---|---|
| best | 0 | 自动选择合适展示位置 |
| upper right | 1 | 右上角 |
| upper left | 2 | 左上角 |
| lower right | 3 | 右下角 |
| lower left | 4 | 左下角 |
| right | 5 | 右侧 |
| center left | 6 | 左侧中心 |
| center right | 7 | 右侧中心 |
| lower center | 8 | 底部中心 |
| upper center | 9 | 顶部中心 |
| center | 10 | 正中心 |
图例参数说明:
| 参数 | 说明 |
|---|---|
| fontsize | 图例字号大小 |
| prop | 关于文本的设置,以字典形式传给参数prop |
| facecolor | 图例框的背景颜色 |
| edgecolor | 图例框的边框颜色 |
| title | 图例标题 |
| title_fontsize | 图例标题的大小 |
| shadow | 是否给图例框添加阴影,默认为False |
图表标题设置
plt.title(lable = '标题',loc = 'left') # 默认是居中显示
loc参数说明:
| 字符串 | 说明 |
|---|---|
| center | 居中显示 |
| left | 居左显示 |
| right | 居右显示 |
设置数据标签
plt.text(x,y,str,ha,va,fontsize)
text函数中的参数说明:
| 参数 | 说明 |
|---|---|
| 参数(x,y) | 分别表示在哪里显示数值 |
| str | 表示要显示的具体数值 |
| horizontalalignment | 简称ha,表示str在水平方向的位置,有center、left、right可选 |
| verticalalignment | 简称va,表示str在垂直方向的位置,有center、left、right可选 |
| fontsize | 设置str字体的大小 |
# 针对具体的某一点(x,y)显示数值str
pt.text(5,10,'极点值')   # 在(5,10)处显示该点的y值

# 对整个图表显示数据标签
# 在(x,y)处显示y值
for a,b in zip(x,y):
    plt.text(a,b,b,ha = 'center', va = 'bottom',fontsize = 11)
图表注释
plt.annotate(s,xy,xytext,arrowprops)
plt.annotates函数中的参数说明:
| 参数 | 说明 |
|---|---|
| s | 表示要注释的文本内容 |
| xy | 表示要注释的位置 |
| xytext | 表示要注释的文本的显示位置 |
| arrowprops | 设置箭的相关参数、颜色、类型 |
plt,annotate('服务器崩解',xy = (5,10),xytest = (6,18),arrowprops = dict(facecolor = 'black',arrowstyle = '->')) # facecolor表示箭的颜色,arrowstyle表示箭的类型


