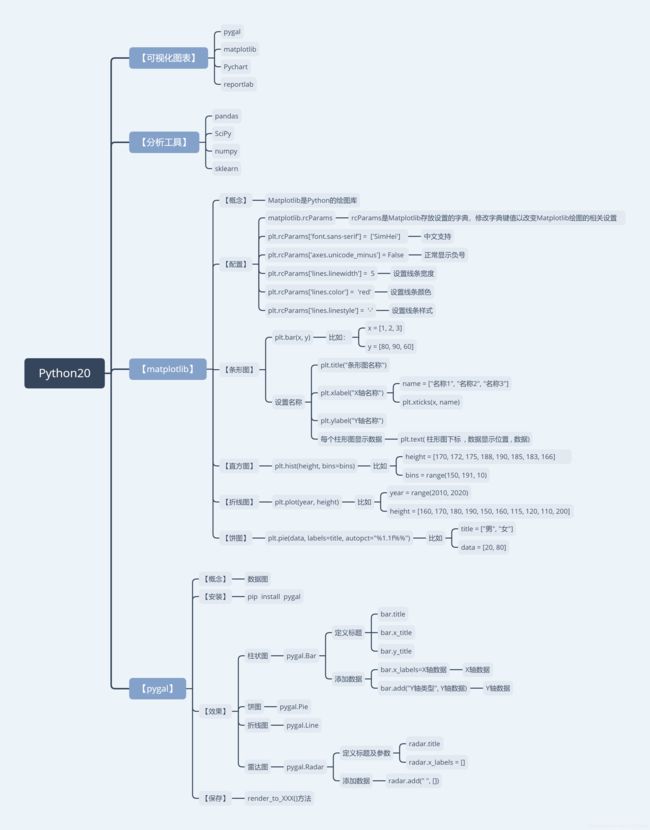
柱形图
"""
使用Matplotlib模块:实现数据可视化
"""
import matplotlib.pyplot as plt
"""
实现柱形图:
需求:展示 张三、李四、王五 的每个月工资
"""
classes = ["张三", "李四", "王五"]
avgSalary = [6666, 9999, 8888]
plt.bar(classes, avgSalary)
plt.rcParams["font.sans-serif"] = ["SimHei"]
plt.xlabel("人名")
plt.ylabel("薪资")
plt.title("薪资柱形图")
for i in range(0, 3):
plt.text(i, avgSalary[i], avgSalary[i])
plt.show()
直方图
"""
直方图
"""
import matplotlib.pyplot as plt

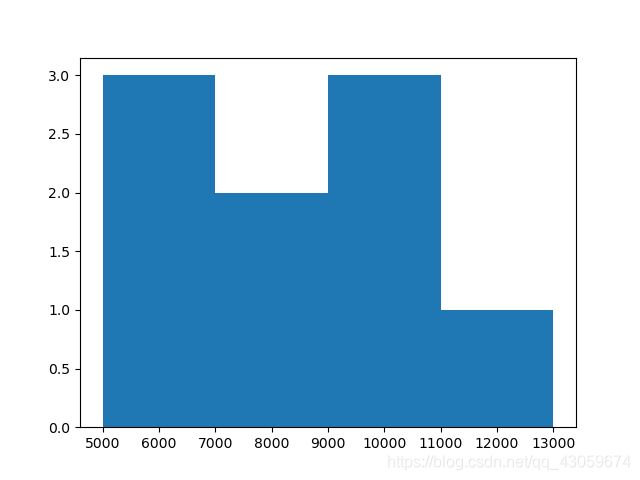
salaries = [5555, 6666, 5432, 8888, 12000, 9999, 7777, 10000, 9988]
bins = range(5000, 14000, 2000)
plt.hist(salaries, bins=bins)
plt.show()

折线图
"""
折线图
"""
import matplotlib.pyplot as plt

years = range(2020, 2026)
salary = [50000, 100000, 150000, 200000, 50000, 300000]
plt.plot(years, salary)
plt.show()

饼图
"""
饼图
"""
import matplotlib.pyplot as plt
plt.rcParams["font.sans-serif"] = ["SimHei"]
title = ["吃饭", "睡觉", "玩游戏"]
data = [100, 200, 50]
plt.pie(data, labels=title, autopct="%1.1f%%")
plt.show()


