Matplotlib中的fill_between总结(转载)
转自:https://blog.csdn.net/kabuto_hui/article/details/84979606
Matplotlib中的fill_between()函数总结
最近在处理数据的时候,需要从数据集合中选出数据来作为训练集,不同的筛选规则得到的数据块的分布一样,所以就想查看一下选取了那些数据块,比如将选中的数据换一种颜色来表示,但是数据如果比较多的话,就不太能看的出来了,所以如果将选中的数据块以柱状的形式框出来就好了,这个时候我看到了fill_between()函数,但是网上关于这个函数的博客都写的不太明白,所以我自己研究了一下,将其总结如下:
1. 生成测试数据
import numpy as np
import matplotlib.pyplot as plt

x = np.array([i for i in range(30)])
y = np.random.rand(30)

plt.plot(x, y)
plt.show()
- 1
- 2
- 3
- 4
- 5
- 6
- 7
- 8
2. 曲线覆盖
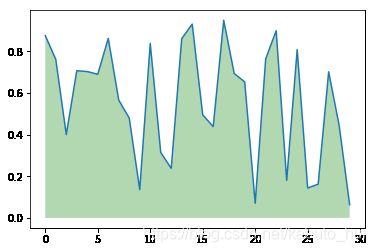
我随机生成了上图所示的数据,现在我想将曲线下面的部分全部覆盖为绿色,这个时候只需要调用函数fill_between()就可以实现:
plt.plot(x, y)   # 先将图画出来
plt.fill_between(x, 0, y, facecolor='green', alpha=0.3)
plt.show()
- 1
- 2
- 3
可以看到,我用了这个函数的几个参数:x:第一个参数表示覆盖的区域,我直接复制为x,表示整个x都覆盖0:表示覆盖的下限y:表示覆盖的上限是y这个曲线facecolor:覆盖区域的颜色alpha:覆盖区域的透明度[0,1],其值越大,表示越不透明
3. 部分区域覆盖
plt.plot(x, y)   # 先将图画出来
plt.fill_between(x[2:15], 0.2, 0.6, facecolor='green', alpha=0.3)
plt.show()
- 1
- 2
- 3
我将x改为x[2:15],y改成了0.6,这样它就在x轴的214,y轴的0.20.6画出了这样一个矩形
4. 两曲线之间的部分填充
y1 = np.random.rand(30)  # 生成第一条曲线
y2 = y1 + 0.3            # 生成第二条曲线
plt.plot(x, y1, 'b')
plt.plot(x, y2, 'r')
plt.fill_between(x, y1, y2, facecolor='green', alpha=0.3)
plt.show()
- 1
- 2
- 3
- 4
- 5
- 6
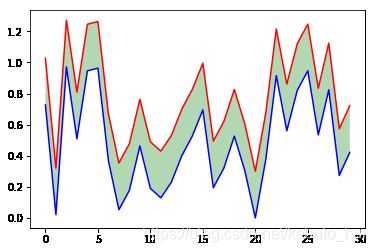
把下限换成y1,上限换成y2,在整个x轴上进行填充,这样就可以实现将两条曲线之间的部分进行填充。
5. 我想实现的数据高亮功能
x = np.array([i for i in range(30)])
y = np.random.rand(30)

# 设置想要高亮数据的位置
position = [[1, 6],
            [10, 12],
            [20, 23],
            [26, 28]]

# 画图
plt.plot(x, y, 'r')
for i in position:
    plt.fill_between(x[ i[0] : i[1] ], 0, 1, facecolor='green', alpha=0.3)
plt.show()
- 1
- 2
- 3
- 4
- 5
- 6
- 7
- 8
- 9
- 10
- 11
- 12
- 13
- 14
只需要循环填充你想要填充的部分,设置填充的上下限,就可以实现这个功能了!


