数据压缩作业 QMF滤波器
一、调试并运行论文中的matlab代码
clc;clear;close all;

N=41;
w=0.43;
[h0,h1,g0,g1]=firpr2chfb(N,w);
[H1z,w]=freqz(h0,1,512);
H1_abs=abs(H1z);H1_db=20*log10(H1_abs);
[H2z,w]=freqz(h1,1,512);
H2_abs=abs(H2z);H2_db=20*log10(H2_abs);

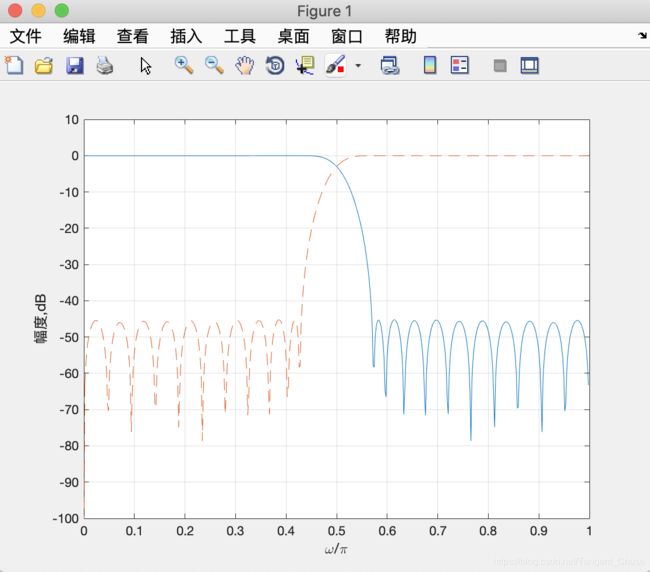
%滤波器h0和h1的幅度响应
figure(1);
plot(w/pi,H1_db,'-',w/pi,H2_db,'--');
axis([0,1,-100,10]);
grid
xlabel('\omega/\pi');ylabel('幅度,dB');
sum1=H1_abs.*H1_abs+H2_abs.*H2_abs;
d=10*log10(sum1);

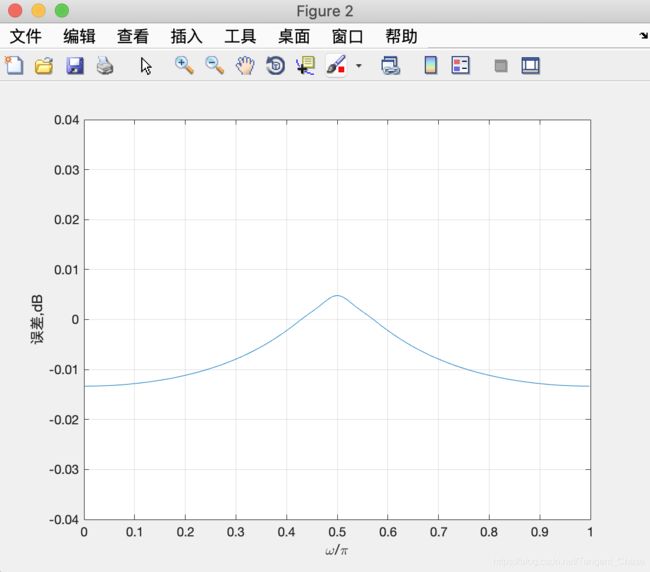
%幅度响应关系误差
figure(2)
plot(w/pi,d);grid;
xlabel('\omega/\pi');ylabel('误差,dB');
axis([0,1,-0.04,0.04]);
%%%%%%%%%%%%%x1(n)%%%%%%%%%%%%%%%%%%%%%
x=zeros(1,500);
x(2)=1;x(3)=1;
x(6)=2;x(7)=2;x(8)=2;
x(17)=1.5;x(18)=1.5;x(19)=1.5;
x(24)=1;x(25)=1;
x(33)=3;x(34)=3;x(35)=3;
%%%%%%%%%%%%%%x2(n)%%%%%%%%%%%%%%%%%%%%
x=zeros(1,500);
x(1)=1;x(2)=1;x(3)=1;
x(9)=2;x(10)=2;x(11)=2;
x(16)=3;x(17)=3;x(18)=3;
x(24)=4;x(25)=4;x(26)=4;
x(33)=3;x(34)=3;x(35)=3;
x(41)=2;x(42)=2;x(43)=2;
x(49)=1;x(50)=1;x(51)=1;
%%%%%%%%%%%%%%x3(n)%%%%%%%%%%%%%%%%%%%%
n=1:500;
T=0.2;
x=sin(n*T);
hlp=mfilt.firdecim(2,h0);
hhp=mfilt.firdecim(2,h1);
glp=mfilt.firinterp(2,g0);
ghp=mfilt.firinterp(2,g1);
x0=filter(hlp,x);
x0=filter(glp,x0);
x1=filter(hhp,x);
x1=filter(ghp,x1);
xidle=x0+x1;
xshift=[zeros(1,N) x(1:end-N)];
e=xidle-xshift;
mes=sum(abs(e).^2)/length(e)
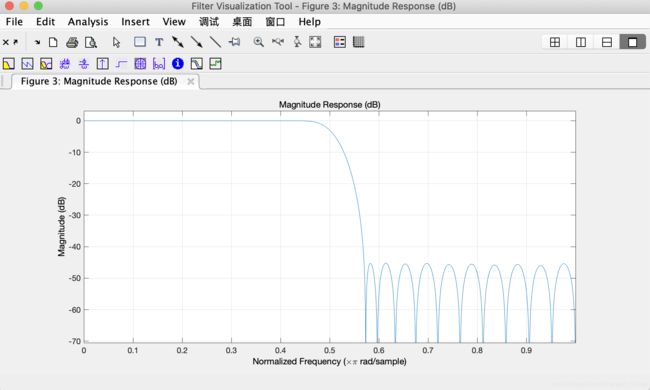
fvtool(h0)

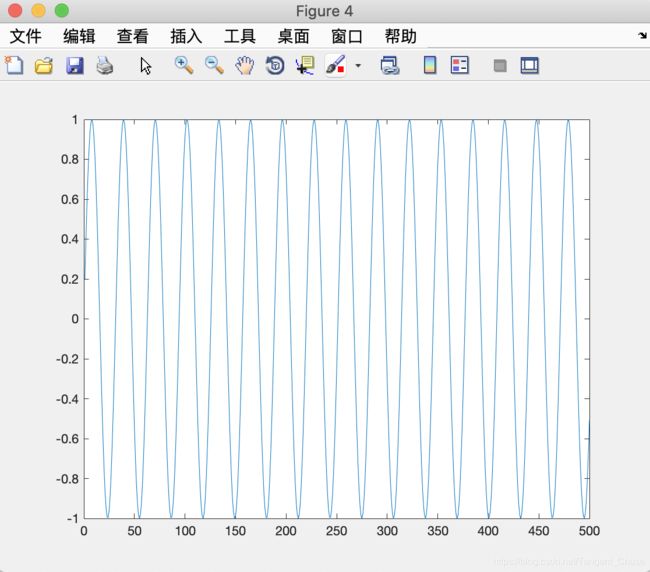
%输入信号
figure(4);
plot(x);
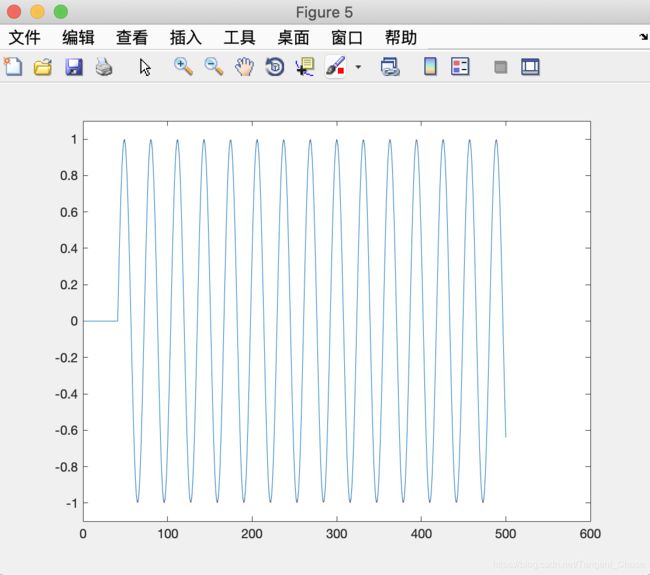
%理想输出信号与重建输出信号
figure(5);
axis([0,500,-1,1]);
plot(xshift,'r');hold on;
plot(xidle,'-');
axis([0,600,-1.1,1.1]);
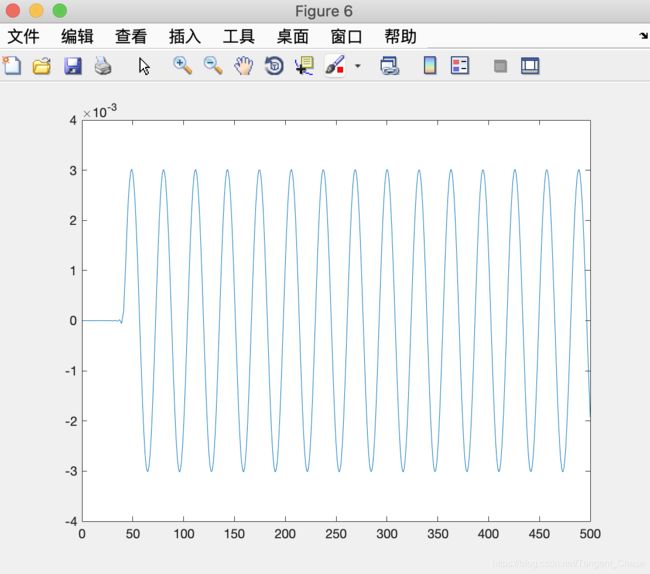
%理想输出信号与重建输出信号的偏差

figure(6);
plot(xshift-xidle);
clc;clear;close all;

N=100;
n=[0:1:N-1];

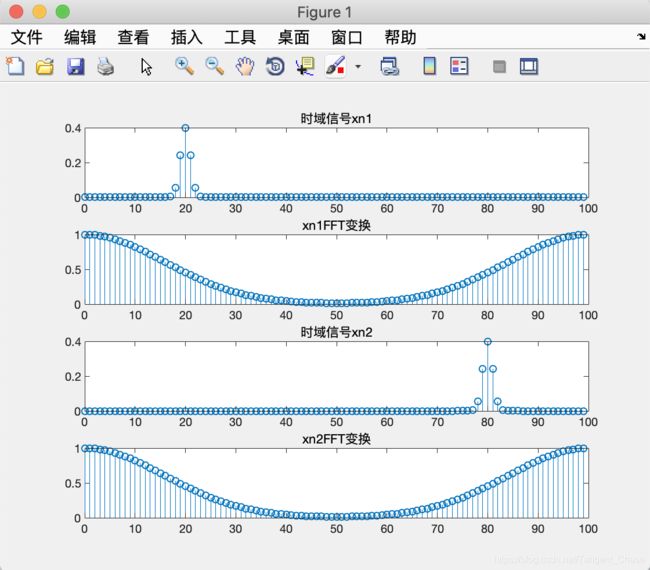
xn1=normpdf(n,20,1);
XK1=fft(xn1,N);
figure(1);
subplot(4,1,1);
stem(n,xn1);
title("时域信号xn1");
subplot(4,1,2);
stem(n,abs(XK1));
title("xn1FFT变换");

xn2=normpdf(n,80,1);
XK2=fft(xn2,N);
subplot(4,1,3);
stem(n,xn2);
title("时域信号xn2");
subplot(4,1,4);
stem(n,abs(XK2));
title("xn2FFT变换");

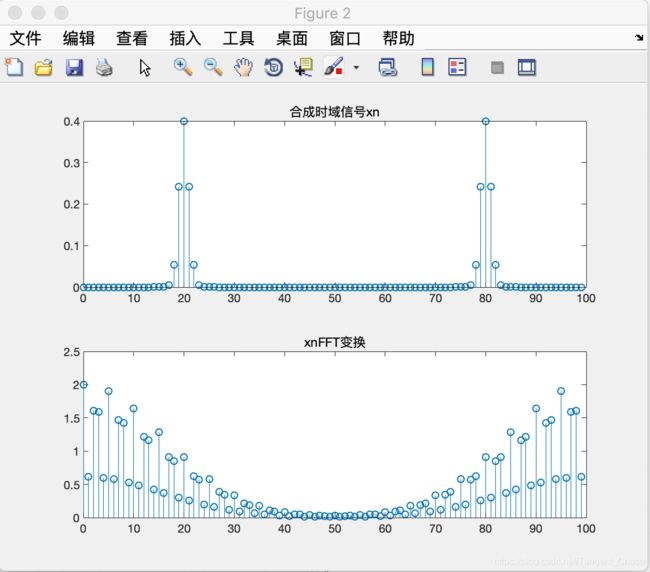
xn=xn1.*(n<50)+xn2.*(n>50);
XK=fft(xn,N);
figure(2);
subplot(2,1,1);
stem(n,xn);
title("合成时域信号xn");
subplot(2,1,2);
stem(n,abs(XK));
title("xnFFT变换");
