前言
QuTip是用于模拟开放量子系统动力学的开源库。QuTip库依赖于的Numpy、Scipy和Cython的数值包。此外,matplotlib提供了图形输出。http://qutip.org/。
python安装比较容易,需要选择一个版本,python2或python3,稍微麻烦的是Scipy。
一、N原子系综自旋概率分布
from qutip import *
import numpy as np
import matplotlib.pyplot as plt

n=2#原子数
j = n//2
psi0 = spin_coherent(j, np.pi/3, 0)#设置系统的初态为自旋相干态

Jp=destroy(2*j+1).dag()#升算符
J_=destroy(2*j+1)#降算符
Jz=(Jp*J_-J_*Jp)/2#Jz

H=Jz**2#系统的哈密顿量

tlist=np.linspace(0,3,100)#时间列表
result=mesolve(H,psi0,tlist)#态随时间的演化

theta=np.linspace(0, np.pi, 50)
phi=np.linspace(0, 2*np.pi, 50)

#分别计算四个状态下的 husimi q函数
Q1, THETA1, PHI1 = spin_q_function(result.states[0], theta, phi)
Q2, THETA2, PHI2 = spin_q_function(result.states[30], theta, phi)
Q3, THETA3, PHI3 = spin_q_function(result.states[60], theta, phi)
Q4, THETA4, PHI4 = spin_q_function(result.states[90], theta, phi)

#在四个子图中分别画出四个状态下的husimi q函数
fig = plt.figure(dpi=150,constrained_layout=1)
ax1 = fig.add_subplot(221,projection='3d')
ax2 = fig.add_subplot(222,projection='3d')
ax3 = fig.add_subplot(223,projection='3d')
ax4 = fig.add_subplot(224,projection='3d')

plot_spin_distribution_3d(Q1, THETA1, PHI1,fig=fig,ax=ax1)
plot_spin_distribution_3d(Q2, THETA2, PHI2,fig=fig,ax=ax2)
plot_spin_distribution_3d(Q3, THETA3, PHI3,fig=fig,ax=ax3)
plot_spin_distribution_3d(Q4, THETA4, PHI4,fig=fig,ax=ax4)

for ax in [ax1,ax2,ax3,ax4]:
 ax.view_init(0.5*np.pi, 0)
 ax.axis('off')#不显示坐标轴

fig.show()
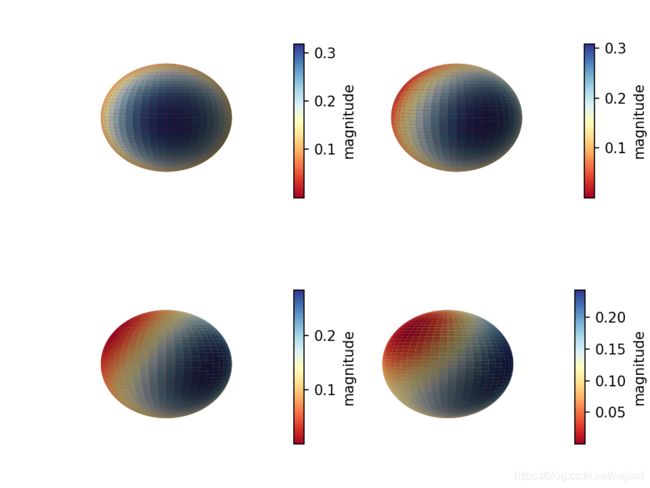
运行结果:
二、原子与光场相互作用
from qutip import *
import numpy as np
import matplotlib.pyplot as plt

alpha=1#相干光的参数alpha
n=2#原子数
j = n/2

psi0 = tensor(coherent(10,alpha),spin_coherent(j, 0, 0))#设置系统的初态

a=destroy(10)#光场的湮灭算符
a_plus=a.dag()#光场的产生算符
Jp=destroy(n+1).dag()#原子的升算符
J_=destroy(n+1)#原子的降算符
Jx=(Jp+J_)/2#原子的Jx算符
Jy=(Jp-J_)/(2j)#原子的Jy算符,这里的j是虚数单位
Jz=(Jp*J_-J_*Jp)/2#原子的Jz算符

H=tensor(a,Jp)+tensor(a_plus,J_)#系统的哈密顿量
tlist=np.linspace(0,10,1000)#时间列表
result=mesolve(H,psi0,tlist)#态随时间的演化

fig=plt.figure()
ax1 = fig.add_subplot(221)
ax2 = fig.add_subplot(222)
ax3 = fig.add_subplot(223)
ax4 = fig.add_subplot(224)

ax1.plot(tlist,expect(tensor(qeye(10),Jx),result.states))#Jx的平均值随时间变化图
ax2.plot(tlist,expect(tensor(qeye(10),Jy),result.states))#Jy的平均值随时间变化图
ax3.plot(tlist,expect(tensor(qeye(10),Jz),result.states))#Jz的平均值随时间变化图
ax4.plot(tlist,expect(tensor(qeye(10),Jx**2+Jy**2+Jz*2),result.states))#J平方的平均值随时间变化图

fig.subplots_adjust(top=None,bottom=None,left=None,right=None,wspace=0.4,hspace=0.4)#设置子图间距
fig.show()
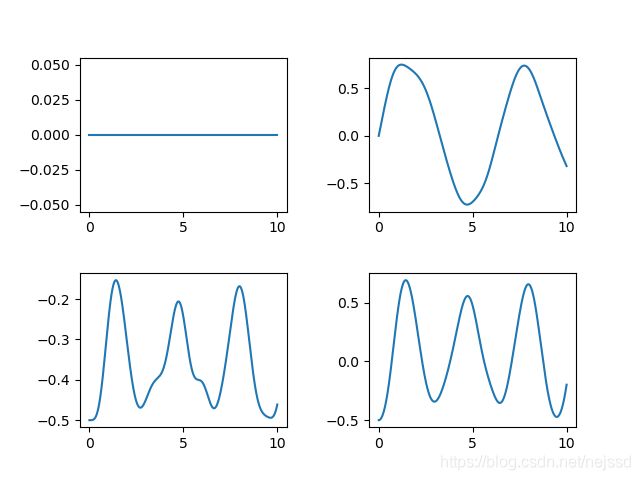
运行结果:
总结
到此这篇关于Python中qutip用法的文章就介绍到这了,更多相关Python qutip用法内容请搜索脚本之家以前的文章或继续浏览下面的相关文章希望大家以后多多支持脚本之家!

