【转载】可交互的可视化神器 Plotly Express
文章转自:可交互的可视化神器 Plotly Express
这个可以嵌入 jupyter notebook 的工具实在是太 coooooooool 了,完胜 matplotlib,转载过来记录一下。
文章目录
- Plotly Express 简介
- 散点图
- 密度图
- 热力图
- 柱状图
- 直方图
- 3D 散点图
- 3D 坐标系
- 地图
- 图像保存
Plotly Express 简介
Plotly Express 是一个新的高级 Python 可视化库:它是 Plotly.py 的高级封装,它为复杂的图表提供了一个简单的语法。
参考 官方文档
安装只需要:
pip install plotly
或者
conda install plotly
然后调用
import plotly.express as px
散点图
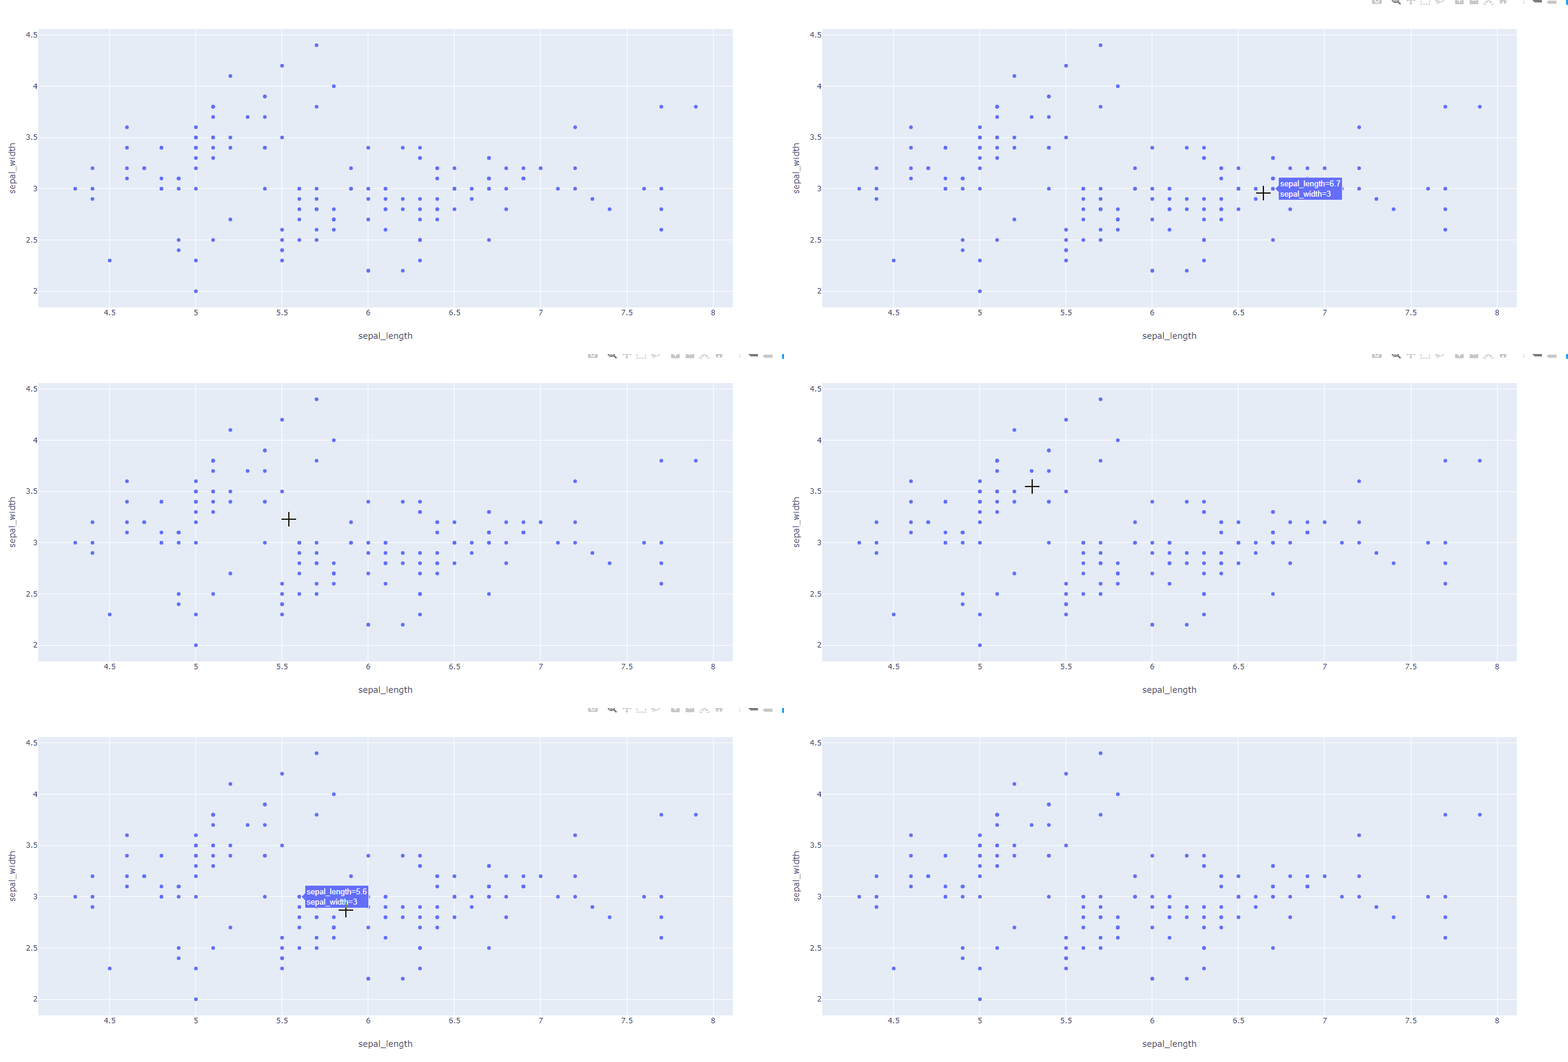
iris = px.data.iris()
fig = px.scatter(iris, x='sepal_length', y='sepal_width')
fig.show()
fig = px.scatter(iris, x='sepal_length', y='sepal_width', color='species',
                 marginal_x='histogram', marginal_y='box', trendline='ols')
fig.show()
iris['error'] = iris['sepal_width']/100.00
fig = px.scatter(iris, x='sepal_length', y='sepal_width', color='species',
                 marginal_x='histogram', marginal_y='box', trendline='ols', error_x='error', error_y='error')
fig.show()
tips = px.data.tips()
fig = px.scatter(tips, x="total_bill", y="tip", facet_row="time", facet_col="day", color="smoker", trendline="ols", category_orders={
     "day": ["Thur", "Fri", "Sat", "Sun"], "time": ["Lunch", "Dinner"]})
fig.show()
fig = px.scatter_matrix(iris, dimensions=["sepal_width", "sepal_length", "petal_width", "petal_length"], color="species")
fig.show()
gapminder = px.data.gapminder()
fig = px.scatter(gapminder.query('year==2007'), x='gdpPercap', y='lifeExp', size='pop', color='continent', hover_name='country', log_x=True, size_max=60)
# gapminder[gapminder['year']==2007]
fig.show()
fig = px.scatter(gapminder, x="gdpPercap", y="lifeExp", animation_frame="year", animation_group="country", size="pop", color="continent", hover_name="country", facet_col="continent", log_x=True, size_max=45, range_x=[100,100000], range_y=[25,90])

fig.show()
密度图
iris = px.data.iris()
fig = px.density_contour(iris, x='sepal_width', y='sepal_length', color='species', marginal_x='histogram', marginal_y='box')

fig.show()
热力图
fig = px.density_heatmap(iris, x='sepal_width', y='sepal_length')
fig.show()
柱状图
fig = px.bar(iris, x='sepal_width', y='sepal_length', color='species')
fig.show()
直方图
fig = px.histogram(iris, x='sepal_width', y='sepal_length', color='species')
fig.show()
3D 散点图
election = px.data.election()
fig = px.scatter_3d(election, x="Joly", y="Coderre", z="Bergeron", color="winner", size="total", hover_name="district",
                  symbol="result", color_discrete_map = {
     "Joly": "blue", "Bergeron": "green", "Coderre":"red"})
fig.show()
3D 坐标系
election = px.data.election()
fig = px.scatter_ternary(election, a="Joly", b="Coderre", c="Bergeron", color="winner", size="total", hover_name="district", size_max=15, color_discrete_map = {
     "Joly": "blue", "Bergeron": "green", "Coderre":"red"} )
fig.show()
地图
注:需要使用mapbox token。
px.set_mapbox_access_token("xxx")
carshare = px.data.carshare()
fig = px.scatter_mapbox(carshare, lat="centroid_lat", lon="centroid_lon", color="peak_hour", size="car_hours",             color_continuous_scale=px.colors.cyclical.IceFire, size_max=15, zoom=10)
fig.show()
gapminder = px.data.gapminder()
fig = px.scatter_geo(gapminder, locations="iso_alpha", color="continent", hover_name="country", size="pop", animation_frame="year", projection="natural earth")
fig.show()
fig = px.choropleth(gapminder, locations="iso_alpha", color="lifeExp", hover_name="country", animation_frame="year", range_color=[20,80])
fig.show()
图像保存
保存为html文件,可以嵌入到网页中。
import plotly.io as pio
pio.write_html(fig, file='test.html')


