Pandas数据可视化原来也这么厉害
一、可视化概述
在Python中,常见的数据可视化库有3个:
matplotlib:最常用的库,可以算作可视化的必备技能库,比较底层,api多,学起来不太容易。
seaborn:是建构于matplotlib基础上,能满足绝大多数可视化需求,更特殊的需求还是需要学习matplotlib。
pyecharts:上面的两个库都是静态的可视化库,而pyecharts有很好的web兼容性,可以做到可视化的动态效果。并且种类也比较丰富。比如这个图,就非常厉害:画图神器pyecharts-旭日图
Pandas:而今天要讲的是Pandas的可视化,Pandas主要作为数据分析的库,虽然没有上述三个库那个强大,但是胜在方便,在数据分析的过程中,只要一行代码就能实现。并且图形也非常漂亮。
二、直接看案例
Pandas 中,有11个比较常见的图形可视化,还有几个比较进阶的,我们一个一个看看怎么画的
import pandas as pd
import numpy  as np
df= pd.DataFrame(np.random.rand(10, 4), columns=['A','B','C','D'])
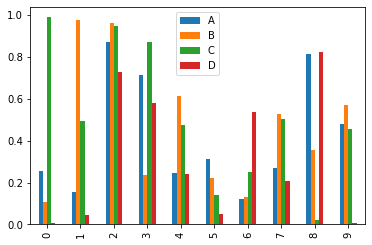
01、柱状图-纵向
df.plot.bar()
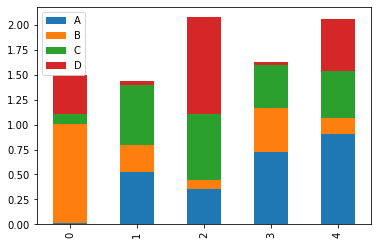
stacked=True,画堆叠柱状图
df.plot.bar(stacked=True)
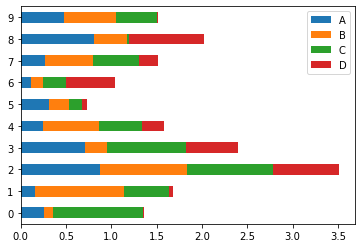
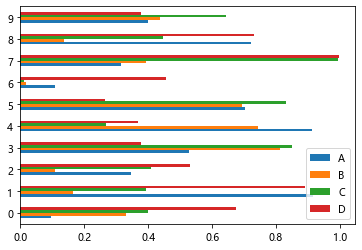
02、柱状图-横向
df.plot.barh()
同样,stacked=True,画堆叠柱状图
df.plot.barh(stacked=True)
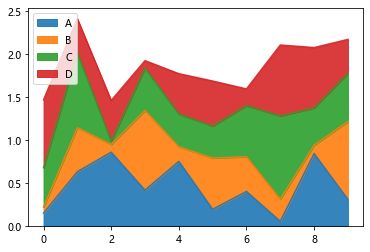
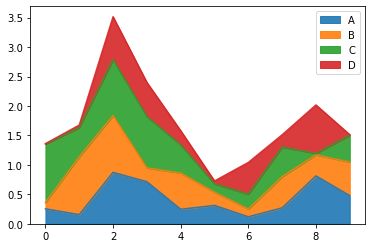
03、面积图
df.plot.area(alpha = 0.9)
df.plot.area(stacked=True,alpha = 0.9)
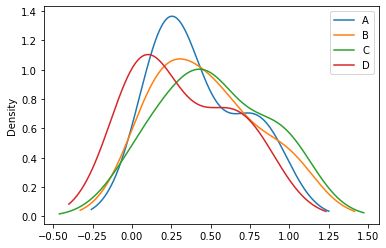
04、密度图-kde
df.plot.kde()
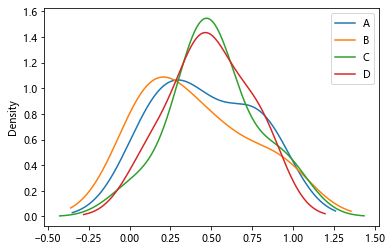
05、密度图-density
df.plot.density()
06、直方图
换个数据集
df = pd.DataFrame({'A': np.random.randn(1000) + 1,
                   'B': np.random.randn(1000),
                   'C': np.random.randn(1000) - 1},
                  columns=['A', 'B', 'C'])
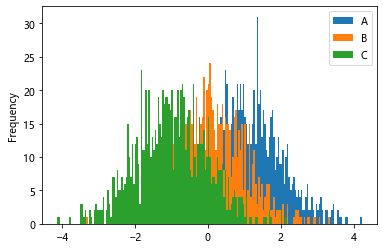
 df.plot.hist(bins=200)
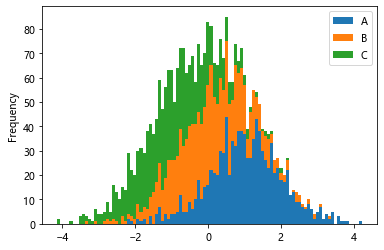
df.plot.hist(stacked=True, bins=20)
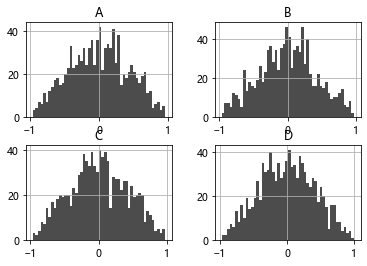
df= pd.DataFrame(np.random.rand(1000, 4), columns=['A','B','C','D'])
df.diff().hist(color='k', alpha=0.7, bins=50)
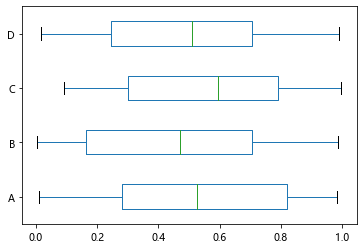
07、箱盒图
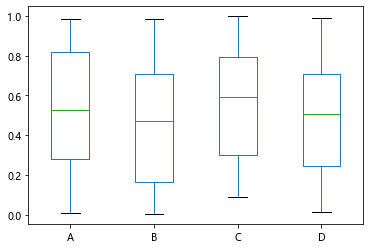
df= pd.DataFrame(np.random.rand(100, 4), columns=['A','B','C','D'])
df.plot.box()
vert=False也可以换成横向
df.plot.box(vert=False)
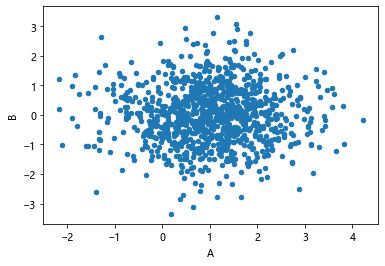
08、散点图
df.plot.scatter(x='A',y='B')
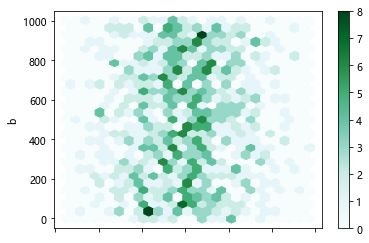
09、蜂巢图
df = pd.DataFrame(np.random.randn(1000, 2), columns=['a', 'b'])
df['b'] = df['b'] + np.arange(1000)
df.plot.hexbin(x='a', y='b', gridsize=25)
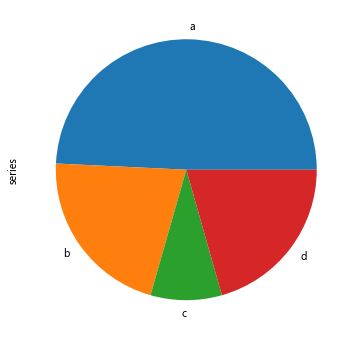
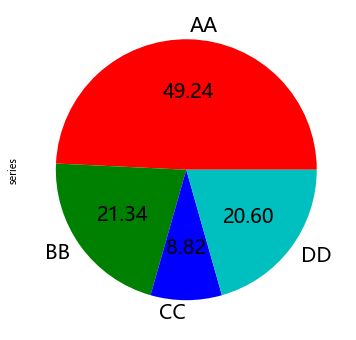
07、饼图
series = pd.Series(3 * np.random.rand(4), index=['a', 'b', 'c', 'd'], name='series')
series.plot.pie(figsize=(6, 6))
series.plot.pie(labels=['AA', 'BB', 'CC', 'DD'], colors=['r', 'g', 'b', 'c'],autopct='%.2f', fontsize=20, figsize=(6, 6))
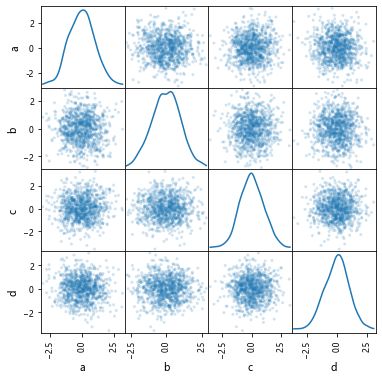
08、矩阵散点图
from pandas.plotting import scatter_matrix
df = pd.DataFrame(np.random.randn(1000, 4), columns=['a', 'b', 'c', 'd'])
scatter_matrix(df, alpha=0.2, figsize=(6, 6), diagonal='kde')
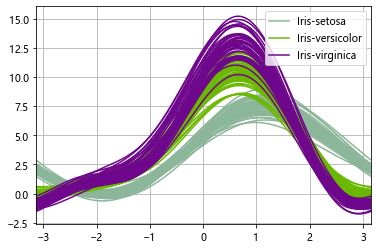
09、安德鲁斯曲线
加载自己的数据,关注公众号【AI入门学习】回复 iris 获取数据集
data = pd.read_csv('C:/Users/wuzhengxiang/Desktop/iris.csv')
pd.plotting.andrews_curves(data , 'Name')
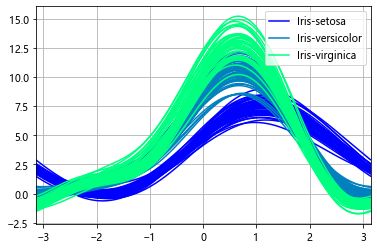
andrews_curves(data, 'Name', colormap='winter')
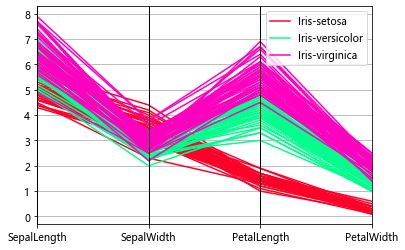
10、平行坐标图
该图也是使用自己加载的iris数据集
from pandas.plotting import parallel_coordinates
parallel_coordinates(data, 'Name', colormap='gist_rainbow')
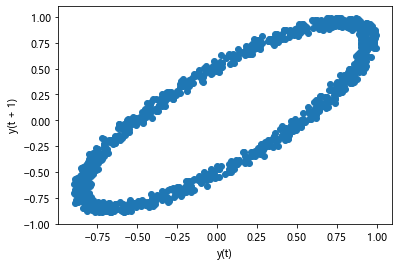
11、Lag Plot
from pandas.plotting import lag_plot
df= pd.Series(0.1 * np.random.rand(1000) +
        0.9 * np.sin(np.linspace(-99 * np.pi, 99 * np.pi, num=1000)))
lag_plot(df)
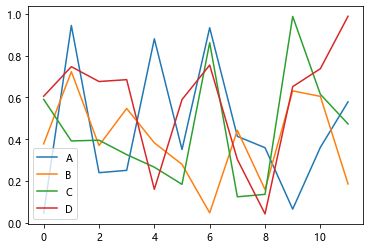
12、默认函数plot
直接画图,默认为折线图
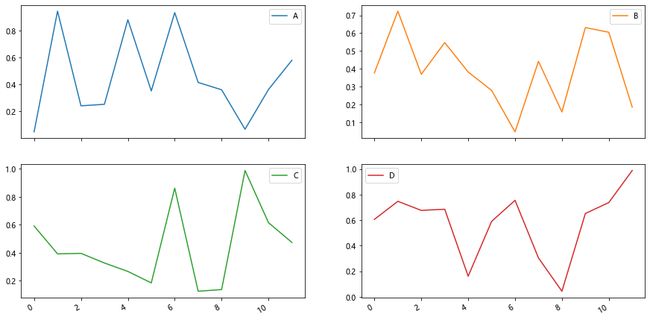
df= pd.DataFrame(np.random.rand(12, 4), columns=['A','B','C','D'])
df.plot()
df.plot(subplots=True,layout=(2, 2), figsize=(15, 8))
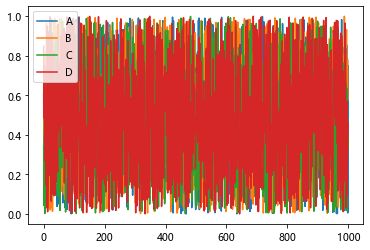
df= pd.DataFrame(np.random.rand(1000, 4), columns=['A','B','C','D'])
df.plot()
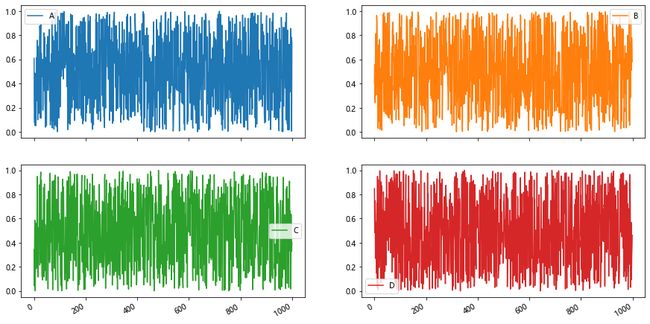
df.plot(subplots=True,layout=(2, 2), figsize=(15, 8))
13、bootstrap_plot
s = pd.Series(np.random.uniform(size=100))
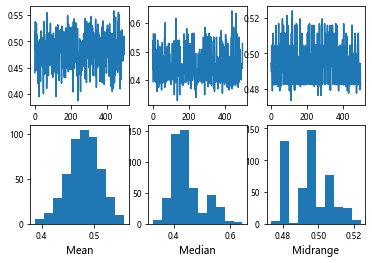
pd.plotting.bootstrap_plot(s)
三、参数详解
1、官方文档
https://pandas.pydata.org/pandas-docs/stable/reference/api/pandas.DataFrame.plot.html
https://pandas.pydata.org/pandas-docs/version/0.18.1/visualization.html
2、参数介绍
DataFrame.plot(x=None, y=None, kind='line', ax=None, subplots=False,
sharex=None, sharey=False, layout=None, figsize=None, use_index=True,
title=None, grid=None, legend=True, style=None, logx=False, logy=False,
loglog=False, xticks=None, yticks=None, xlim=None, ylim=None, rot=None,
fontsize=None, colormap=None, position=0.5, table=False, yerr=None,
xerr=None, stacked=True/False, sort_columns=False, secondary_y=False,
mark_right=True, **kwds)
e, legend=True, style=None, logx=False, logy=False, loglog=False, xticks=None, yticks=None, xlim=None, ylim=None, rot=None, fontsize=None, colormap=None, position=0.5, table=False, yerr=None, xerr=None, stacked=True/False, sort_columns=False, secondary_y=False, mark_right=True, **kwds)
注意:每种绘图类型都有相对应的方法: df.plot(kind='line')与df.plot.line()等价
x : label or position, default None#指数据列的标签或位置参数
y : label, position or list of label, positions, default None
kind : str#绘图类型
‘line’ : line plot (default)#折线图
‘bar’ : vertical bar plot#条形图。stacked为True时为堆叠的柱状图
‘barh’ : horizontal bar plot#横向条形图
‘hist’ : histogram#直方图(数值频率分布)
‘box’ : boxplot#箱型图
‘kde’ : Kernel Density Estimation plot#密度图,主要对柱状图添加Kernel 概率密度线
‘density’ : same as ‘kde’
‘area’ : area plot#与x轴所围区域图(面积图)。Stacked=True时,每列必须全部为正或负值,stacked=False时,对数据没有要求
‘pie’ : pie plot#饼图。数值必须为正值,需指定Y轴或者subplots=True
‘scatter’ : scatter plot#散点图。需指定X轴Y轴
‘hexbin’ : hexbin plot#蜂巢图。需指定X轴Y轴
‘hexbin’ : hexbin plot#蜂巢图。需指定X轴Y轴
ax : matplotlib axes object, default None#**子图(axes, 也可以理解成坐标轴) 要在其上进行绘制的matplotlib subplot对象。如果没有设置,则使用当前matplotlib subplot**其中,变量和函数通过改变figure和axes中的元素(例如:title,label,点和线等等)一起描述figure和axes,也就是在画布上绘图。
subplots : boolean, default False#是否对列分别作子图
sharex : boolean, default True if ax is None else False#如果ax为None,则默认为True,否则为False
In case subplots=True, share x axis and set some x axis labels to invisible; defaults to True if ax is None otherwise False if an ax is passed in; Be aware, that passing in both an ax and sharex=True will alter all x axis labels for all axis in a figure!
sharey : boolean, default False#如果有子图,子图共y轴刻度,标签
In case subplots=True, share y axis and set some y axis labels to invisible
layout : tuple (rows, columns) for the layout of subplots#子图的行列布局
figsize : a tuple (width, height) in inches#图片尺寸大小
use_index : boolean, default True#默认用索引做x轴
title : string#图片的标题用字符串
Title to use for the plot
grid : boolean, default None#图片是否有网格
legend : False/True/’reverse’#子图的图例 (默认为True)
style : list or dict#对每列折线图设置线的类型
logx : boolean, default False#设置x轴刻度是否取对数
logy : boolean, default False
loglog : boolean, default False#同时设置x,y轴刻度是否取对数
xticks : sequence#设置x轴刻度值,序列形式(比如列表)
yticks : sequence#设置y轴刻度,序列形式(比如列表)
xlim : float/2-tuple/list#设置坐标轴的范围。数值(最小值),列表或元组(区间范围)
ylim : float/2-tuple/list
rot : int, default None#设置轴标签(轴刻度)的显示旋转度数
fontsize : int, default None#设置轴刻度的字体大小
colormap : str or matplotlib colormap object, default None#设置图的区域颜色
colorbar : boolean, optional #柱子颜色
If True, plot colorbar (only relevant for ‘scatter’ and ‘hexbin’ plots)
position : float #条形图的对齐方式,取值范围[0,1],即左下端到右上端默认0.5(中间对齐)
layout : tuple (optional) #布局。layout=(2, 3)两行三列,layout=(2, -1)两行自适应列数
Eg. df.plot(subplots=True, layout=(2, -1), sharex=False)
table : boolean, Series or DataFrame, default False #图下添加表。如果为True,则使用DataFrame中的数据绘制表格,并且数据将被转置以满足matplotlib的默认布局。。
yerr : DataFrame, Series, array-like, dict and str
See Plotting with Error Bars for detail.
xerr : same types as yerr.
stacked : boolean, default False in line and bar plots, and True in area plot. If True, create stacked plot. #前面有介绍
sort_columns : boolean, default False #对列名称进行排序以确定绘图顺序
secondary_y : boolean or sequence, default False #设置第二个y轴(右辅助y轴)
Whether to plot on the secondary y-axis If a list/tuple, which columns to plot on secondary y-axis
mark_right : boolean, default True
![]()
