Games101学习笔记二(锯齿、模糊等失真的本质)
文章目录
- Aliasing
- Antialiasing思路
-
- 采样前模糊
- 从频域分析抗锯齿的本质
-
- 滤波等于去掉高频信息
-
- 滤掉低频部分
- 滤掉高频部分
- 高频低频都滤掉
- 滤波等于卷积也等于平均
- 采样等于重复频率内容
- Aliasing等于混掉了频率内容
- Antialiasing
-
- Antialiased Sampling
- Antialiasing By Supersampling (MSAA)
- 现在成熟的方案
- 引用
内容参考来自闫令琪老师的课程,有兴趣的同学可以去看完整课程
Aliasing
在计算机图形学中,很多失真(artifact)都是由于采样,比如
- Jaggies – sampling in space (在空间采样不够)
- Moire – undersampling images (图像欠采样)
- Wagon wheel effect – sampling in time (在时间上欠采样)
Signals are changing too fast (high frequency), but sampled too slowly
究其根本就是信号是高频的,但是采样率不够。
Antialiasing思路
采样前模糊
红色的三角形光栅化采样的时候,由于硬切边,所以最后采样后的结果buffer中会出现jaggies.

但是如果在Sample之前做一次滤波,那么最终的效果会好很多。
从频域分析抗锯齿的本质

而欠采样则会导致频域失真,因为重构出来的图像损失了原来的高频信息
滤波等于去掉高频信息
Filtering = Getting rid of certain frequency content
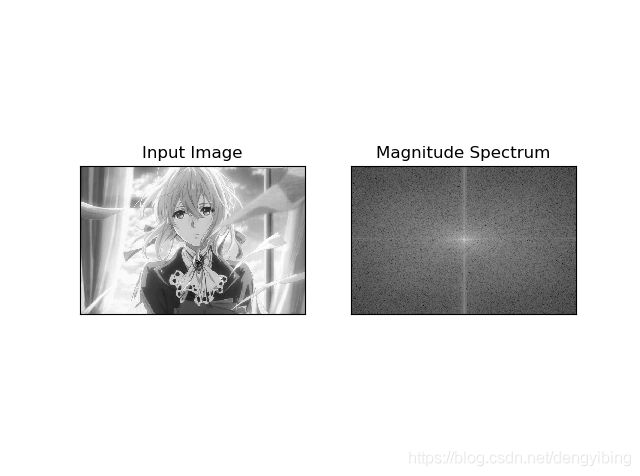
贴出opencv的傅里叶变换的demo
import cv2 as cv
import numpy as np
from matplotlib import pyplot as plt
img = cv.imread('messi5.jpg',0)
f = np.fft.fft2(img)
fshift = np.fft.fftshift(f)
magnitude_spectrum = 20*np.log(np.abs(fshift))
plt.subplot(121),plt.imshow(img, cmap = 'gray')
plt.title('Input Image'), plt.xticks([]), plt.yticks([])
plt.subplot(122),plt.imshow(magnitude_spectrum, cmap = 'gray')
plt.title('Magnitude Spectrum'), plt.xticks([]), plt.yticks([])
plt.show()
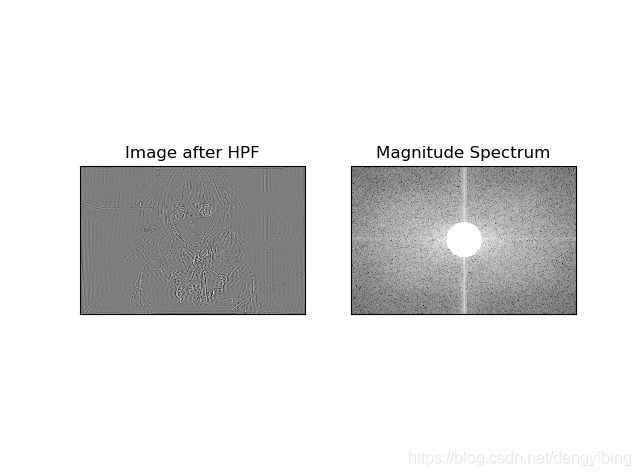
滤掉低频部分
rows, cols = img.shape
crow,ccol = rows//2 , cols//2
for r in range(rows):
    for c in range(cols):
        if(np.sqrt((r - crow)*(r - crow)+(c - ccol)*(c - ccol)) < 50):
            fshift[r,c] = 0

f_ishift = np.fft.ifftshift(fshift)
img_back = np.fft.ifft2(f_ishift)
img_back = np.real(img_back)

plt.figure(2)
plt.subplot(121),plt.imshow(img_back, cmap = 'gray')
plt.title('Image after HPF'), plt.xticks([]), plt.yticks([])
plt.subplot(122),plt.imshow(20*np.log(np.abs(fshift)), cmap = 'gray')
plt.title('Magnitude Spectrum'), plt.xticks([]), plt.yticks([])
plt.show()
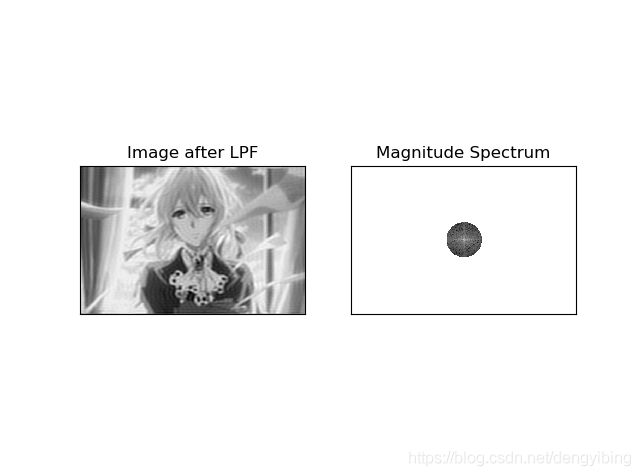
滤掉高频部分
fshift2 = fshift
for r in range(rows):
    for c in range(cols):
        if(np.sqrt((r - crow)*(r - crow)+(c - ccol)*(c - ccol)) >= 50):
            fshift2[r,c] = 0

f_ishift = np.fft.ifftshift(fshift2)
img_back = np.fft.ifft2(f_ishift)
img_back = np.real(img_back)

plt.figure(3)
plt.subplot(121),plt.imshow(img_back, cmap = 'gray')
plt.title('Image after LPF'), plt.xticks([]), plt.yticks([])
plt.subplot(122),plt.imshow(20*np.log(np.abs(fshift2)), cmap = 'gray')
plt.title('Magnitude Spectrum'), plt.xticks([]), plt.yticks([])
plt.show()
高频低频都滤掉
fshift3 = fshift
for r in range(rows):
    for c in range(cols):
        dis = np.sqrt((r - crow)*(r - crow)+(c - ccol)*(c - ccol))
        if(dis >= 50 or dis < 20):
            fshift3[r,c] = 0

f_ishift = np.fft.ifftshift(fshift3)
img_back = np.fft.ifft2(f_ishift)
img_back = np.real(img_back)

plt.figure(4)
plt.subplot(121),plt.imshow(img_back, cmap = 'gray')
plt.title('Image after LPF'), plt.xticks([]), plt.yticks([])
plt.subplot(122),plt.imshow(20*np.log(np.abs(fshift3)), cmap = 'gray')
plt.title('Magnitude Spectrum'), plt.xticks([]), plt.yticks([])
plt.show()
滤波等于卷积也等于平均
Filtering = Convolution (= Averaging)
时域的卷积等于频域的乘积
所以为了去掉高频信息,我们有两种选择
- 在时域进行卷积
-
- 先用傅里叶变换转换到频域
- 再在频域与傅里叶变换后的卷积核相乘
- 把结果通过反傅里叶变换转换回时域
 从图中可以看到方形滤波器就是一个低通滤波器,直接与图片做卷积,只保留了低频的信息,所以图片变模糊了。
而且我们可以看到方波滤波器在频域是Sinc函数的形式,会有震荡,在球谐分析中,我们也遇到了类似的问题,处理方案就是不要使用硬切边的核函数。
采样等于重复频率内容
Sampling = Repeating Frequency Contents
| The evolution of sampling theorem. (a) The time domain of the band-limited signal and (b) the frequency spectrum with band width of f 0 ; © The time domain signal of the sampled function and (d) the frequency spectrum with repetition of f s ; (e) and (f) the time domain signal and the frequency spectrum of the obtained signal, respectively. |
|---|
Aliasing等于混掉了频率内容
Antialiasing
减少失真的方法
1、增加采样率
- 增加频域中采样实例的距离
- 使用更大的分辨率,包括屏幕、传感器,framebuffers等,这样更耗,而且有可能需要非常高的分辨率
2、Antialiasing - 在重复其内容前,使得傅里叶变换后的内容更加窄。比如在采样前滤掉高频信号
Antialiased Sampling

常用的滤波核,如 Box-filter

在像素域Antialiasing可以使用上面提到的核函数与图片做卷积,然后再做采样。
Antialiasing By Supersampling (MSAA)
在一个像素里面采样多个点并平均,来逼近一个像素大的 Box-filter 滤波的结果。
 当然MASS的每次采样都是需要执行FragmentShader的,所以会更加的耗。
现在成熟的方案
- FXAA(Fast Approximate AA):找到边缘部分,只对边缘部分做filter
- TAA:在时间上做filter
引用
[1]https://sites.cs.ucsb.edu/~lingqi/teaching/resources/
[2]https://docs.opencv.org/master/de/dbc/tutorial_py_fourier_transform.html


