爬取冰冰B站千条评论,看看大家说了什么!
数据分析
import pandas as pddata = pd.read_excel(r"bingbing.xlsx")
data.head()
| 用户 |
性别 |
等级 |
评论 |
点赞 |
|---|
数据预处理
数据描述
data.describe()
| 等级 |
点赞 |
|---|
删除空值
data.dropna()
| 用户 |
性别 |
等级 |
评论 |
点赞 |
|---|
1180 rows × 5 columns
删除空值
data.drop_duplicates()
| 用户 |
性别 |
等级 |
评论 |
点赞 |
|---|
1179 rows × 5 columns
可视化
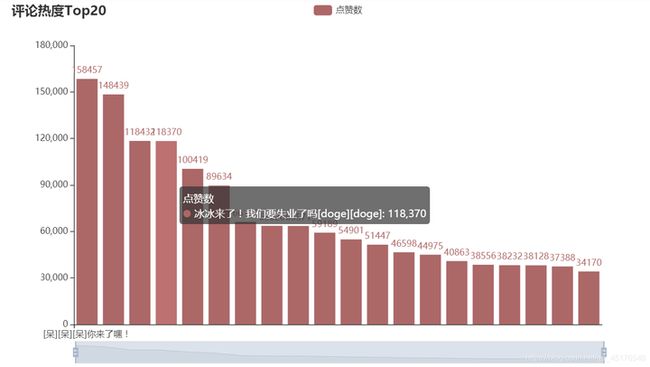
点赞TOP20
df1 = data.sort_values(by="点赞",ascending=False).head(20)from pyecharts import options as opts
from pyecharts.charts import Bar
from pyecharts.faker import Faker

c1 = (
    Bar()
    .add_xaxis(df1["评论"].to_list())
    .add_yaxis("点赞数", df1["点赞"].to_list(), color=Faker.rand_color())
    .set_global_opts(
        title_opts=opts.TitleOpts(title="评论热度Top20"),
        datazoom_opts=[opts.DataZoomOpts(), opts.DataZoomOpts(type_="inside")],
    )
    .render_notebook()
)
c1
等级分布
data.等级.value_counts().sort_index(ascending=False)6    165
5    502
4    312
3    138
2     63
Name: 等级, dtype: int64from pyecharts import options as opts
from pyecharts.charts import Pie
from pyecharts.faker import Faker

c2 = (
    Pie()
    .add(
        "",
        [list(z) for z in zip([str(i) for i in range(2,7)], [63,138,312,502,165])],
        radius=["40%", "75%"],
    )
    .set_global_opts(
        title_opts=opts.TitleOpts(title="等级分布"),
        legend_opts=opts.LegendOpts(orient="vertical", pos_top="15%", pos_left="2%"),
    )
    .set_series_opts(label_opts=opts.LabelOpts(formatter="{b}: {c}"))
    .render_notebook()
)
c2
性别分布
data.性别.value_counts().sort_index(ascending=False)from pyecharts import options as opts
from pyecharts.charts import Pie
from pyecharts.faker import Faker

c4 = (
    Pie()
    .add(
        "",
        [list(z) for z in zip(["男","女","保密"], ["404",'103','673'])],
        radius=["40%", "75%"],
    )
    .set_global_opts(
        title_opts=opts.TitleOpts(title="性别分布"),
        legend_opts=opts.LegendOpts(orient="vertical", pos_top="15%", pos_left="2%"),
    )
    .set_series_opts(label_opts=opts.LabelOpts(formatter="{b}: {c}"))
    .render_notebook()

)
c4
绘制词云图
from wordcloud import WordCloud
import jieba
from tkinter import _flatten
from matplotlib.pyplot import imread
from PIL import Image, ImageDraw, ImageFont
import matplotlib.pyplot as pltwith open('stoplist.txt', 'r', encoding='utf-8') as f:
    stopWords = f.read()
with open('停用词.txt','r',encoding='utf-8') as t:
    stopWord = t.read()
total = stopWord.split() + stopWords.split()def my_word_cloud(data=None, stopWords=None, img=None):
    dataCut = data.apply(jieba.lcut)  # 分词
    dataAfter = dataCut.apply(lambda x: [i for i in x if i not in stopWords])  # 去除停用词
    wordFre = pd.Series(_flatten(list(dataAfter))).value_counts()  # 统计词频
    mask = plt.imread(img)
    plt.figure(figsize=(20,20))
    wc  = WordCloud(scale=10,font_path='C:/Windows/Fonts/STXINGKA.TTF',mask=mask,background_color="white",)
    wc.fit_words(wordFre)
    plt.imshow(wc)
    plt.axis('off')my_word_cloud(data=data["评论"],stopWords=stopWords,img="1.jpeg")
数据收集
后记
近期有很多朋友通过私信咨询有关Python学习问题。为便于交流,点击蓝色自己加入讨论解答资源基地


