二手车交易价格预测:Task4 建模调参
一、数据的读取和压缩
其中读取数据在之前已多次使用过,因此不再赘述,主要介绍一下数据的压缩。我们主要针对非object类的数据进行压缩(比如int和float类型)。根据int和float特征的取值范围来用最短的二进制位数将其表示,从而达到压缩的目的。
def reduce_mem_usage(df):
    """ iterate through all the columns of a dataframe and modify the data type
        to reduce memory usage.
    """
    start_mem = df.memory_usage().sum()                                                 # 计算最初文件大小
    print('Memory usage of dataframe is {:.2f} MB'.format(start_mem))

    for col in df.columns:
        col_type = df[col].dtype

        if col_type != object:                                                          # 只压缩非object类型的特征
            c_min = df[col].min()
            c_max = df[col].max()
            if str(col_type)[:3] == 'int':
                if c_min > np.iinfo(np.int8).min and c_max < np.iinfo(np.int8).max:     # 最大值特征小于(2^8-1)的,用int8表示(brand和train)
                    df[col] = df[col].astype(np.int8)
                elif c_min > np.iinfo(np.int16).min and c_max < np.iinfo(np.int16).max: # 最大值特征小于(2^16-1)的,用int16表示(power)
                    df[col] = df[col].astype(np.int16)
                elif c_min > np.iinfo(np.int32).min and c_max < np.iinfo(np.int32).max: # 最大值特征小于(2^32-1)的,用int32表示(SaleID和name)
                    df[col] = df[col].astype(np.int32)
                elif c_min > np.iinfo(np.int64).min and c_max < np.iinfo(np.int64).max: # 最大值特征小于(2^64-1)的,用int64表示(无)
                    df[col] = df[col].astype(np.int64)
            else:
                if c_min > np.finfo(np.float16).min and c_max < np.finfo(np.float16).max: # 特征model,bodyType,fuelType,gearbox和所有的匿名特征等大多数
                    df[col] = df[col].astype(np.float16)
                elif c_min > np.finfo(np.float32).min and c_max < np.finfo(np.float32).max: # price,brand_price_max,brand_price_sum
                    df[col] = df[col].astype(np.float32)
                else:                                                                       # 无特征属于此类
                    df[col] = df[col].astype(np.float64)
        else:
            df[col] = df[col].astype('category')                                           # notRepairedDamage属于此情况,忘记替换'-'了
    end_mem = df.memory_usage().sum()
    print('Memory usage after optimization is: {:.2f} MB'.format(end_mem))
    print('Decreased by {:.1f}%'.format(100 * (start_mem - end_mem) / start_mem))
    return df
结果显示,我们之前task3中存储用作树模型的数据压缩了74%,可见其压缩程度还是很可观的。
二、训练集数据的处理
1.特征值筛选
首先将所有的取值为连续的特征筛选出来存储到continuous_feature_names中,然后对特征进行筛选。
continuous_feature_names = [x for x in sample_feature.columns if x not in ['price','brand','model','brand']]
sample_feature = sample_feature.dropna().replace('-', 0).reset_index(drop=True)  #去掉所有包含Nan特征的数据,将剩余的特征中包含'-'的替换为0,然后将所有数据的序号重新编号
print(sample_feature)
结果的一部分如下所示:
[91729 rows x 37 columns]
我们先来结合代码来看一下是如何进行特征的筛选的,dropna()函数去掉了所有包含异常值Nan的特征(所有预测集的price都是Nan,所以所有的预测集数据都被去除了),replace('-',0)将特征值中的'-'替换为0,reset_index将所有的数据重新编号(0-91728)。因此我们处理后的数据由原来的190,000多条减少为90,000多条。
2.训练集和测试集的重新构造
sample_feature['notRepairedDamage'] = sample_feature['notRepairedDamage'].astype(np.float32)
train = sample_feature[continuous_feature_names + ['price']]

train_X = train[continuous_feature_names]
train_y = train['price']
将特征'notRepairedDamage'压缩存储,并且在之前筛选好的连续特征中加入特征price构成训练集train_X,其中训练集标签为train_Y。
三、训练模型
1.训练线性模型并查看
利用训练集数据训练模型,并查看其权重和偏置。
from sklearn.linear_model import LinearRegression
model = LinearRegression(normalize=True)                                            # 使用线性回归模型
model = model.fit(train_X, train_y)                                                 # 训练模型
print('intercept:'+ str(model.intercept_))                                          # 模型的偏置b
print(sorted(dict(zip(continuous_feature_names, model.coef_)).items(), key=lambda x:x[1], reverse=True))  # 模型权重w
intercept:-110670.68276752878
[('v_6', 3367064.3416419267), ('v_8', 700675.560939941), ('v_9', 170630.27723225282), ('v_7', 32322.661932062252), ('v_12', 20473.67079691944), ('v_3', 17868.079541470484), ('v_11', 11474.938996692706), ('v_13', 11261.764560005584), ('v_10', 2683.9200905786092), ('gearbox', 881.8225039247907), ('fuelType', 363.90425072154414), ('bodyType', 189.60271012069205), ('city', 44.94975120520423), ('power', 28.553901616754167), ('brand_price_median', 0.5103728134078587), ('brand_price_std', 0.45036347092631623), ('brand_amount', 0.14881120395066377), ('brand_price_max', 0.003191018670315719), ('SaleID', 5.355989919853636e-05), ('train', -4.837755113840103e-06), ('brand_price_sum', -2.175006868187753e-05), ('name', -0.00029800127131177567), ('used_time', -0.002515894332880398), ('brand_price_average', -0.4049048451011015), ('brand_price_min', -2.2467753486895288), ('power_bin', -34.420644117294245), ('v_14', -274.7841180771386), ('kilometer', -372.89752666070945), ('notRepairedDamage', -495.19038446282883), ('v_0', -2045.0549573539531), ('v_5', -11022.986240349139), ('v_4', -15121.73110985004), ('v_2', -26098.299920490896), ('v_1', -45556.18929728922)]
关于权重的代码可能有点晦涩,我们详细的解释一下:model.coef_会得到一个只由权重组成的列表,我们用zip()将其变成迭代变量,再用dict()将其变成字典形式。其中字典的key值为特征的名字,key对应的value为该特征对应的权重。之后sorted函数将该字典中的内容排序,其中key = lambda x:x[1]表示按照下标为1的元素进行排序。
2.模型的可视化
运用matplotlib库来实现模型的可视化,随机挑选50个数据可视化其真实值与预测值。
subsample_index = np.random.randint(low=0, high=len(train_y), size=50)              # 随机取50个数据用来可视化
plt.scatter(train_X['v_9'][subsample_index], train_y[subsample_index], color='black')
plt.scatter(train_X['v_9'][subsample_index], model.predict(train_X.loc[subsample_index]), color='blue') # loc是通过行标签索引数据,iloc是通过行索引来索引数据
plt.xlabel('v_9')
plt.ylabel('price')
plt.legend(['True Price','Predicted Price'],loc='upper right')
print('The predicted price is obvious different from true price')
plt.show()
其中model.predict(train_X.loc[subsample_index])表示该50个数据的预测值,其中loc是通过行标签索引数据,iloc是通过行索引来索引数据。(所以我们得到的是这50个数据的所有特征)
其可视化结果如下。
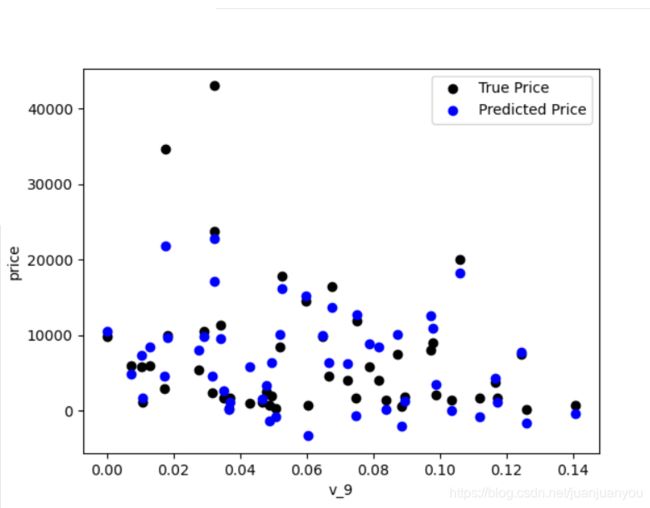
由上图可见,我们的模型对该数据拟合的不是很好,而且出现了price<0的异常预测,下面我们可视化原数据和标签看看导致拟合不好的原因。
plt.figure(figsize=(15,5))
plt.subplot(1,2,1)
sns.distplot(train_y)
plt.subplot(1,2,2)
sns.distplot(train_y[train_y < np.quantile(train_y, 0.9)])
plt.show()
我们分别可视化了所有的数据和标签从小到大排序中前90%的数据。其结果如下所示:
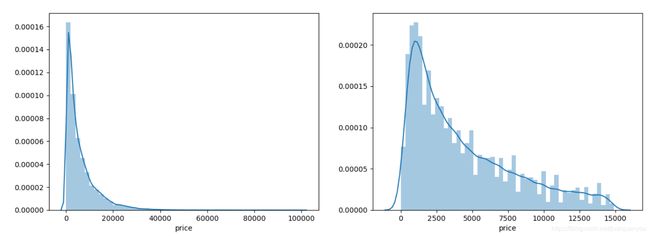
由此可见,真实值有较多值偏大,原分布应该是长尾分布(与我们task3中结论一致),而我们假设其为正态分布,因此出现了模型不拟合的现象。而我们采用长尾阶段后的右图比左图更接近正态分布了。
3.调整标签值使其拟合正态分布
为了使原数据更符合正态分布,我们对预测值price取对数log(price+1)后再重复以上操作。注:之所以在对数内部+1是为了保证取对数后所有price都为正。我们看一下取对数后的数据分布:
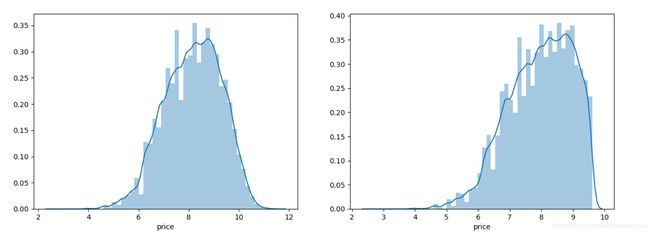
由上图可见,经过取对数处理的数据已经十分接近正态分布了。我们用第1和2中相同的方法再次训练模型和可视化。(注意price之前取了对数,所以预测的时候要取指数还原)
subsample_index = np.random.randint(low=0, high=len(train_y), size=50)
plt.scatter(train_X['v_9'][subsample_index], train_y[subsample_index], color='black')
plt.scatter(train_X['v_9'][subsample_index], np.exp(model.predict(train_X.loc[subsample_index])), color='blue')
plt.xlabel('v_9')
plt.ylabel('price')
plt.legend(['True Price','Predicted Price'],loc='upper right')
print('The predicted price seems normal after np.log transforming')
plt.show()
其可视化结果如下图所示:
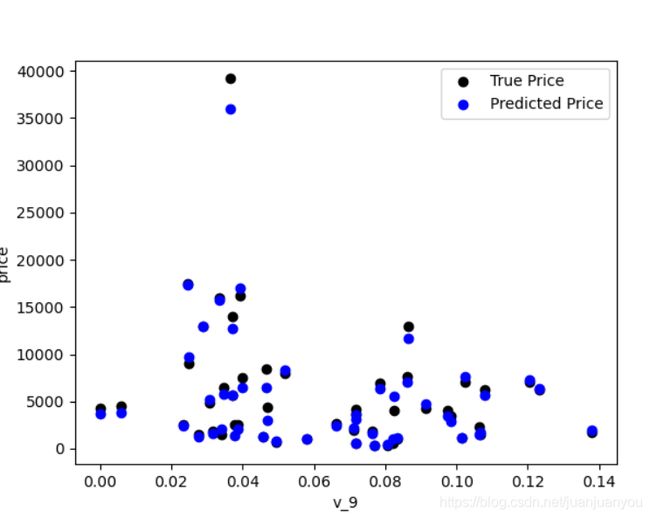
由上图可见预测值和真实值已经非常接近了,而且并未出现小于0的异常值。
4.五折交叉验证
以上对模型的评估都是对可视化结果的感性认识,下面我们通过五折交叉验证对模型进行量化的评估。
model = LinearRegression(normalize=True)                                            # 使用线性回归模型
model = model.fit(train_X, train_y)

def log_transfer(func):
    def wrapper(y, yhat):
        result = func(np.log(y), np.nan_to_num(np.log(yhat)))
        return result
    return wrapper

scores = cross_val_score(model, X=train_X, y=train_y, verbose=1, cv = 5, scoring=make_scorer(log_transfer(mean_absolute_error)))
print(np.mean(scores))
我们先对取对数前的模型进行五折交叉验证,其中损失函数是平均绝对误差mean_absolute_error。其中log_transfer()是对取对数前的训练特征与标签取了对数,为了与处理过标签的模型具有可对比性。其结果如下所示:
[Parallel(n_jobs=1)]: Using backend SequentialBackend with 1 concurrent workers.
[Parallel(n_jobs=1)]: Done   5 out of   5 | elapsed:    0.7s finished
1.3658024042407948
再对取对数后的模型进行相同的五折交叉验证,损失函数不变。
scores = cross_val_score(model, X=train_X, y=train_y_ln, verbose=1, cv = 5,scoring=make_scorer(mean_absolute_error))
print(np.mean(scores))
其结果如下:
[Parallel(n_jobs=1)]: Using backend SequentialBackend with 1 concurrent workers.
0.19325301535176917
[Parallel(n_jobs=1)]: Done   5 out of   5 | elapsed:    0.7s finished
可见损失函数的值缩小了很多,从而验证了取对数对模型的对数据有更好的拟合效果。
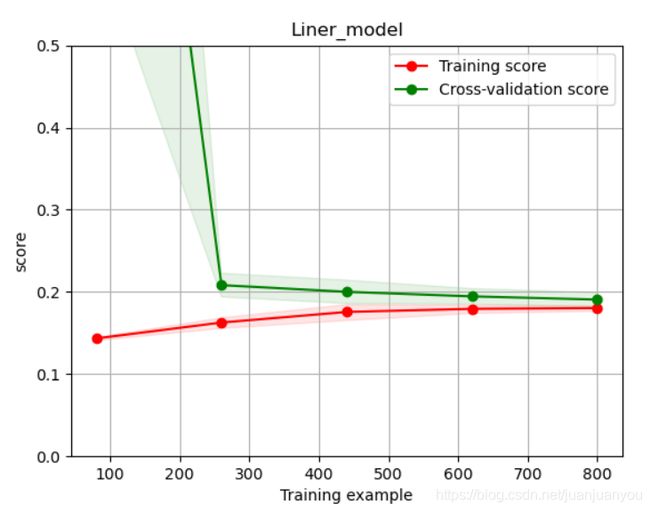
5.绘制可视化学习过程
通过可视化模型在训练集和验证集上的得分来观察模型的学习过程是否正常(我们只观察了前1000个数据的训练)。
def plot_learning_curve(estimator, title, X, y, ylim=None, cv=None,n_jobs=1, train_size=np.linspace(.1, 1.0, 5 )):
    plt.figure()
    plt.title(title)
    if ylim is not None:
        plt.ylim(*ylim)
    plt.xlabel('Training example')
    plt.ylabel('score')
    train_sizes, train_scores, test_scores = learning_curve(estimator, X, y, cv=cv, n_jobs=n_jobs, train_sizes=train_size, scoring = make_scorer(mean_absolute_error))
    train_scores_mean = np.mean(train_scores, axis=1)
    train_scores_std = np.std(train_scores, axis=1)
    test_scores_mean = np.mean(test_scores, axis=1)
    test_scores_std = np.std(test_scores, axis=1)
    plt.grid()
    plt.fill_between(train_sizes, train_scores_mean - train_scores_std,
                     train_scores_mean + train_scores_std, alpha=0.1,
                     color="r")
    plt.fill_between(train_sizes, test_scores_mean - test_scores_std,
                     test_scores_mean + test_scores_std, alpha=0.1,
                     color="g")
    plt.plot(train_sizes, train_scores_mean, 'o-', color='r',
             label="Training score")
    plt.plot(train_sizes, test_scores_mean,'o-',color="g",
             label="Cross-validation score")
    plt.legend(loc="best")
    return plt

plot_learning_curve(LinearRegression(), 'Liner_model', train_X[:1000], train_y_ln[:1000], ylim=(0.0, 0.5), cv=5, n_jobs=1)
plt.show()
四、多模型对比
上面我们已经学会了训练线性模型并且通过可视化等手段查看其模型的拟合程度和学习曲线。但是线性模型会无限的去拟合所给的数据,因此可能会发生过拟合现象,因此我们可以采用一定的方式去抑制模型的过拟合现象,此处我们采用的是正则化方法:引入L1正则化后,线性模型就变成了Ridge(岭回归)模型;引入L2正则化后,线性模型变成了Lasso回归模型。
下面我们训练一下三个模型
train_X = train[continuous_feature_names]                               # 训练特征
train_y = train['price']                                                # 训练标签
train_y_ln = np.log(train_y + 1)                                        # 经过处理后的标签

models = [LinearRegression(), Ridge(), Lasso()]
result = dict()
for model in models:
    model_name = str(model).split('(')[0]
     #该出model_name的类型为str,将models设为[LinearRegression, Ridge, Lasso]直接调用是不行的,因为他不是纯的str类型
    scores = cross_val_score(model, X=train_X, y=train_y_ln, verbose=0, cv = 5, scoring=make_scorer(mean_absolute_error))
    result[model_name] = scores
    print(model_name + ' is finished')
result = pd.DataFrame(result)
result.index = ['cv' + str(x) for x in range(1, 6)]
print(result)
结果如下所示:
LinearRegression is finished
Ridge is finished
Lasso is finished
     LinearRegression     Ridge     Lasso
cv1          0.194215  0.197440  0.425300
cv2          0.196832  0.200353  0.423237
cv3          0.197197  0.200743  0.425816
cv4          0.193815  0.197268  0.416200
cv5          0.199186  0.202552  0.424730
如果几个得分均为Nan的话,注意看一下是否所有的数据都转化为了int和float类型,(原特征值中的'-'是否替换为了Nan)
如果没有替换的话,注意替换一下(应该是在做树模型的数据时就处理掉了,当时偷懒没处理。)sample_feature['notRepairedDamage'].replace('-', np.nan, inplace=True)
1.线性模型
问先首先观察一下线性模型中的各特征所占的权重:
model = LinearRegression().fit(train_X, train_y_ln)
print('intercept:'+ str(model.intercept_))
print(sorted(dict(zip(continuous_feature_names, abs(model.coef_))).items(), key=lambda x:x[1], reverse=True))
sns.barplot(abs(model.coef_), continuous_feature_names)
plt.show()
结果如下:
intercept:16.017580981858497
[('v_6', 241.21056986275232), ('v_8', 36.3726055143274), ('v_5', 15.254592580473194), ('v_9', 10.627899210371455), ('v_7', 2.4343938517641726), ('v_12', 2.267419257874273), ('v_1', 1.6818443359896467), ('v_2', 1.6393330741343088), ('v_11', 1.5319508241552382), ('v_10', 1.3691128355685787), ('v_13', 1.1384284754126275), ('v_3', 1.077152222952474), ('v_4', 0.9864466830109655), ('notRepairedDamage', 0.28955167134511856), ('v_14', 0.019989865527629096), ('power_bin', 0.016917319212187726), ('kilometer', 0.01527246720732313), ('fuelType', 0.01089897322573498), ('gearbox', 0.008282965206454497), ('v_0', 0.007283097719842351), ('bodyType', 0.005625974307685659), ('city', 0.0015624761718292636), ('brand_price_min', 2.717905422345179e-05), ('used_time', 9.592091112409676e-06), ('brand_amount', 2.9471400444434714e-06), ('brand_price_median', 2.9209119378091535e-06), ('brand_price_std', 1.8445227835735426e-06), ('brand_price_average', 8.3826551606019e-07), ('brand_price_max', 4.981200036618067e-07), ('name', 7.645872957427482e-08), ('SaleID', 3.422278443143373e-08), ('brand_price_sum', 1.0641238504414232e-10), ('train', 4.9492188125555003e-11)]
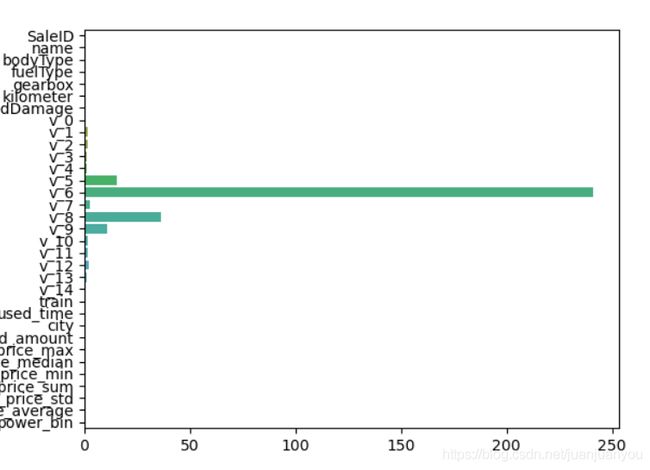
由输出的结果和可视化的图我们均可以得出,特征v_6对分类起到了决定性作用,因此特征V_6出现较小的变化都会很大程度的影响到价格的预测,我们认为这不是一个稳定的模型。
2.岭回归模型(L1正则化的线性回归)
接下来我们用相同的方法看看岭回归模型的表现:
model = Ridge().fit(train_X, train_y_ln)
print('intercept:'+ str(model.intercept_))
print(sorted(dict(zip(continuous_feature_names, abs(model.coef_))).items(), key=lambda x:x[1], reverse=True))
sns.barplot(abs(model.coef_), continuous_feature_names)
plt.show()
结果如下:
intercept:2.9567476975026556
[('v_9', 0.7784055320434677), ('v_8', 0.6378665249626475), ('v_6', 0.5023805867170547), ('v_7', 0.43224414007027107), ('notRepairedDamage', 0.30214755748353145), ('v_13', 0.21401675450708874), ('v_4', 0.1823876855392232), ('v_12', 0.1517699636082835), ('v_3', 0.11441775918119552), ('v_0', 0.11159094446028639), ('v_11', 0.10433668997208093), ('v_10', 0.09809984669465552), ('v_2', 0.07778118656012699), ('v_5', 0.05595561221938397), ('v_14', 0.055658226970249254), ('v_1', 0.02109283544518849), ('power_bin', 0.015885709445207844), ('kilometer', 0.01350921973136689), ('fuelType', 0.009903601993258156), ('gearbox', 0.007497104056267937), ('bodyType', 0.005454760478423963), ('city', 0.001992277298504252), ('brand_price_min', 2.9616453445592214e-05), ('brand_price_average', 8.631013611176926e-06), ('brand_price_median', 3.255137622130516e-06), ('brand_amount', 3.1237538112883524e-06), ('used_time', 2.2753685467115965e-06), ('brand_price_max', 6.674364019969317e-07), ('brand_price_std', 4.823825663504846e-07), ('name', 1.1968182993037065e-07), ('SaleID', 3.298648121144553e-08), ('brand_price_sum', 2.2532126250841043e-10), ('train', 0.0)]

有结果和上图我们可见,岭回归的权重分布在各特征中相对更均匀一些, 因此比直接的线性模型有更强的稳定性。
3.Losso回归(L2正则化的线性回归)
代码与之前完全一样,不再赘述,其结果如下所示:
intercept:9.147746318306794
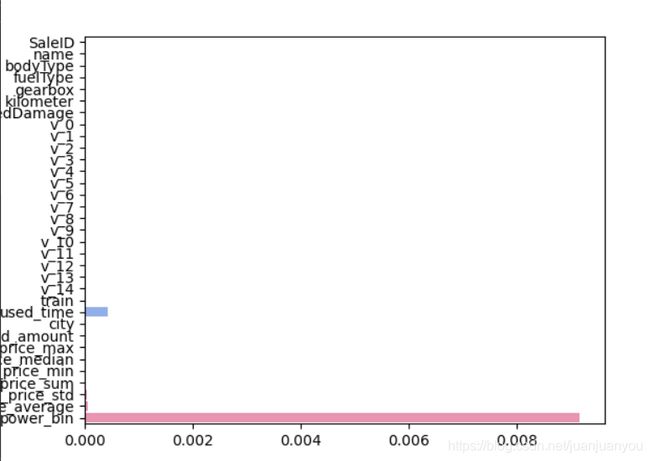
可见特征的权重与偏置比起来小很多,因此结果更大程度上可能由偏置决定。
因而在三个线性模型中,L1正则化有助于生成一个稀疏权值矩阵,更有助于树模型生成时进行特征选择。
4.其他非线性模型的效果对比
在介绍了以上常用的三种线性模型后,我们再对比一下常用的非线性模型;
models = [LinearRegression(),
          DecisionTreeRegressor(),
          RandomForestRegressor(),
          GradientBoostingRegressor(),
          MLPRegressor(solver='lbfgs', max_iter=100),
          LGBMRegressor(n_estimators = 100)]
#
result = dict()
for model in models:
    model_name = str(model).split('(')[0]
    scores = cross_val_score(model, X=train_X, y=train_y_ln, verbose=0, cv = 5, scoring=make_scorer(mean_absolute_error))
    result[model_name] = scores
    print(model_name + ' is finished')
result = pd.DataFrame(result)
result.index = ['cv' + str(x) for x in range(1, 6)]
print(result)
结果如下所示:
     LinearRegression  DecisionTreeRegressor  RandomForestRegressor  GradientBoostingRegressor  MLPRegressor   LGBMRegressor
cv1          0.194215               0.206370               0.138523                   0.172588    327.455357        0.145716
cv2          0.196832               0.198161               0.139520                   0.175431    156.239093        0.148115
cv3          0.197197               0.200043               0.138838                   0.175979    651.126250        0.148882
cv4          0.193815               0.196634               0.136666                   0.170791    631.948914        0.146080
cv5          0.199186               0.208437               0.142436                   0.177798    431.946855        0.148824
由此我们可见,随机森林回归对此数据的模拟效果很好。
