R语言中ggplot2的地理数据可视化 —— geom_sf 对象
之前geom_polygon对象绘制地图特别麻烦,目前推荐用geom_sf绘制。
文章目录
- 1.需要的R包
- 2.地理数据读取
-
- 2.1 shape数据
- 2.2 json数据
- 3.业务数据构造
- 4.信息可视化
-
- 4.1 九段线
- 4.2 面数据(省份)
- 4.3 GIS点数据
- 4.4 比例尺与指北针
- 4.5 设定显示区域
- 4.6 设置南海诸岛
- 4.7 图片拼接
1.需要的R包
sf空间数据分析函数tidyverse内含大量数据整理函数与ggplot2ggspatial用于指南针和比例尺patchwork用于图片拼接
2.地理数据读取
文中为ArcGIS常用的shape文件,geojson格式应该会简单。文件读取后需要注意坐标系统参数,常用st_crs, st_set_crs,st_transform对坐标系进行查看、设置与转换。
2.1 shape数据
本文以中国省级行政区为地图进行数据可视化。
#st_read数据导入
china2<-st_read(dsn="./china_shapefile",layer="bou2_4p")
st_crs(china2)
china2=st_set_crs(china2,4326) #如果为NA,需要做设置EPSG:4326
china2 <- sf::st_transform(china2, "+init=epsg:4326")#坐标转换为WGS84
2.2 json数据
# http://datav.aliyun.com/tools/atlas/#&lat=30.332329214580188&lng=106.72278672066881&zoom=3.5
china2= read_sf("china.json") #
st_crs(China_map)
地理数据可视化主要有:
- shape多边形数据填充,如各省的GDP数据可视化
- point点数据,如采样点的空间标注
- line线数据,如飞机航路点的线连接
3.业务数据构造
文中以构造的各省人口,以及虚构的数十个经纬度坐标作为采样点的GPS坐标。
需要注意的是构造的点位经纬度数据需要用st_as_sf将其转为sf对象,方能准确实现可视化,否则随坐标系统变化出现偏差。
#增加业务数据列
china2$population<-runif(nrow(china2),1,10) #虚构人口

#增加坐标数据并转换为sf对象
dat_samples=data.frame(jd=sample(seq(90,120,length.out=1000),50),
                       wd=sample(seq(20,50,length.out=1000),50))%>%
  st_as_sf(coords=c("jd","wd"),crs=4326)#转换为sf对象
4.信息可视化
数据可视化主要用geom_sf:
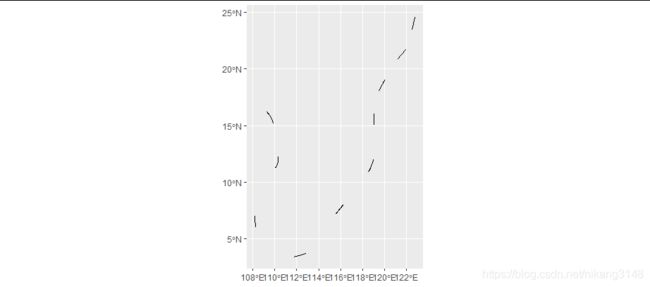
4.1 九段线
p1=ggplot(china2)+
  geom_sf(data=l9) #九段线
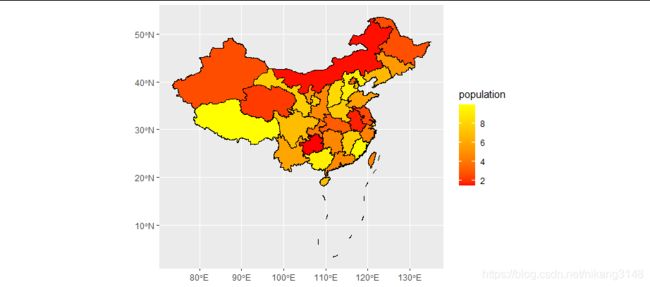
4.2 面数据(省份)
p1=p1+geom_sf(aes(fill=population),col="black")+
  scale_fill_gradientn(colors=heat.colors(2))
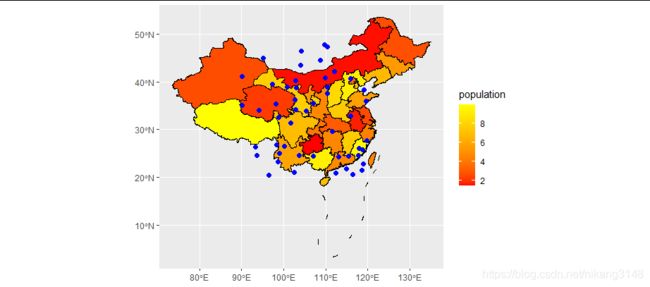
4.3 GIS点数据
p1=p1+geom_sf(data=dat_samples,color="blue",size=2)
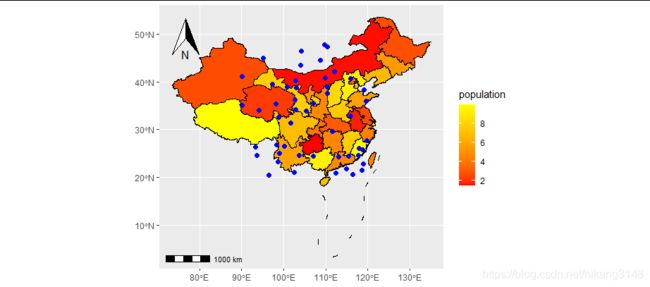
4.4 比例尺与指北针
p1=p1+ggspatial::annotation_scale(location="bl")+ #比例尺
  ggspatial::annotation_north_arrow(location="tl",#tl为top left
                                    height = unit(1.5, "cm"),
                                    width = unit(1, "cm"),
                                    pad_x = unit(0.5, "cm"),
                                    pad_y = unit(0.5, "cm")) #指南针
4.5 设定显示区域
通过coord_sf函数的参数设置:
p1=p1+
  coord_sf(xlim=c(75,135),ylim=c(15,55))+
  theme_bw()
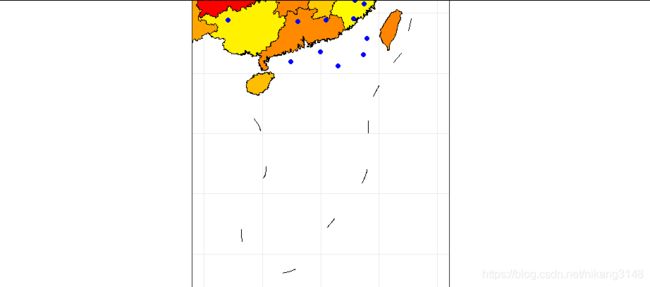
4.6 设置南海诸岛
通过coord_sf函数的参数设置:
p2=ggplot(china2)+
  geom_sf(data=l9)+ #九段线
  geom_sf(aes(fill=population),col="black")+
  geom_sf(data=dat_samples,color="blue",size=2)+
  scale_fill_gradientn(colors=heat.colors(2))+ #以上同大图部分
  coord_sf(xlim=c(105,125),ylim=c(3,25))+ #显示区域局限在南海
  guides(fill=FALSE)+ #去除fill的legend
  theme_bw()+
  theme(axis.text = element_blank(), #不显示坐标刻度文字
  		axis.ticks = element_blank(), #不显示刻度线
        plot.margin=unit(c(0,0,-0.5,-0.5),"lines")) #作图区填充整个区域
p2
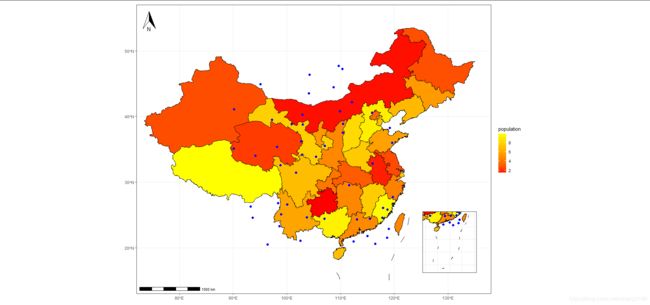
4.7 图片拼接
注意position的原点(0,0)是左下角,以此计算小图四个边线的相对位置
p1 + patchwork::inset_element(p2, align_to = "plot",
                              left = 0.8,  #小图左侧边线的位置
                               bottom = 0.1, #底部边线的位置(底部为0)
                               right = 0.98, # 右侧边线的位置
                                top =0.3) #顶部位置
