Python数据可视化--matplotlib常用图表绘制
常用图表绘制
1.折线图
import matplotlib.pyplot as plt
import pandas as pd

# 数据读入
df = pd.read_csv('../data/data.csv', index_col='年份')

# 获取'人均GDP(元)'这一列的值
y = df['人均GDP(元)'].values

# 获取索引列的值(年份)
x = df.index.values

# 指定默认字体(防止中文出现乱码)
from pylab import mpl
mpl.rcParams['font.sans-serif'] = ['FangSong']  # 指定‘仿宋’字体

# 折线图
fig, ax = plt.subplots()
ax.plot(x, y, 'b-o')
ax.set(title='人均GDP走势图', xlabel='年份', ylabel='人均GDP(元)')  # 中文出现乱码,要先设置字体
plt.show()
# 设置标签字体大小
ax.set_title('折线图')
ax.set_xlabel('年份')
ax.set_ylabel('人均GDP(元)')
2.柱形图
import matplotlib.pyplot as plt
import pandas as pd

# 数据读入
df = pd.read_csv('../data/data.csv', index_col='年份')

# 获取'人均GDP(元)'这一列的值
y = df['人均GDP(元)'].values

# 获取索引列的值(年份)
x = df.index.values

# 指定默认字体(防止中文出现乱码)
from pylab import mpl
mpl.rcParams['font.sans-serif'] = ['FangSong']  # 指定‘仿宋’字体

# 柱形图
fig, ax = plt.subplots()
ax.bar(x, y, 0.5, color='skyblue')  # 0.5是设置的柱子的宽度
ax.set(title='人均GDP走势图', xlabel='年份', ylabel='人均GDP(元)')  # 中文出现乱码,要先设置字体
plt.show()
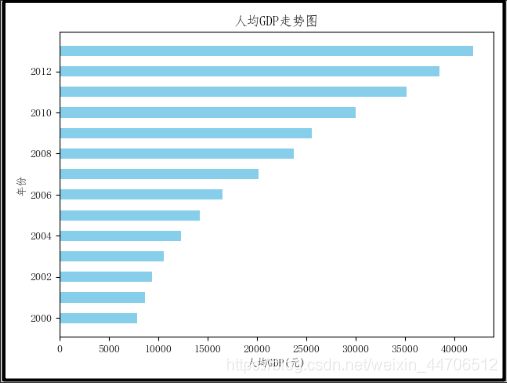
3.水平柱形图---条形图
import matplotlib.pyplot as plt
import pandas as pd

# 数据读入
df = pd.read_csv('../data/data.csv', index_col='年份')

# 获取'人均GDP(元)'这一列的值
y = df['人均GDP(元)'].values

# 获取索引列的值(年份)
x = df.index.values

# 指定默认字体(防止中文出现乱码)
from pylab import mpl
mpl.rcParams['font.sans-serif'] = ['FangSong']  # 指定‘仿宋’字体

# 水平柱形图---条形图
fig, ax = plt.subplots()
ax.barh(x, y, 0.5, color='skyblue')  # 0.5是设置的柱子的宽度
ax.set(title='人均GDP走势图', xlabel='人均GDP(元)', ylabel='年份')
plt.show()
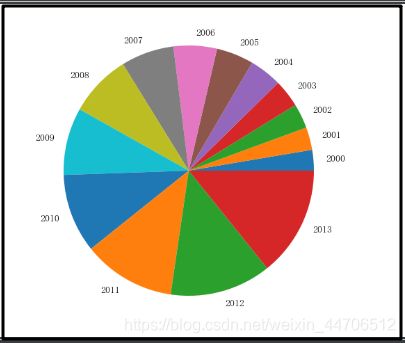
4.饼状图
import matplotlib.pyplot as plt
import pandas as pd

# 数据读入
df = pd.read_csv('../data/data.csv', index_col='年份')

# 获取'人均GDP(元)'这一列的值
y = df['人均GDP(元)'].values

# 获取索引列的值(年份)
x = df.index.values

# 指定默认字体(防止中文出现乱码)
from pylab import mpl
mpl.rcParams['font.sans-serif'] = ['FangSong']  # 指定‘仿宋’字体

# 饼状图
fig, ax = plt.subplots()
ax.pie(y, labels=x)
plt.show()
# 只显示部分数据、设置间隔
ax.pie(y[:5], labels=x[:5], explode=[0,0.05,0.1,0.15,0.2]) 5.散点图
# 数据读入
scatter_df = pd.read_csv('../data/BankData.csv', index_col='分行编号')

x = scatter_df['各项贷款余额']
y = scatter_df['不良贷款(亿元)']

# 指定默认字体(防止中文出现乱码)
from pylab import mpl
mpl.rcParams['font.sans-serif'] = ['FangSong']  # 指定‘仿宋’字体

# 散点图
fig, ax = plt.subplots()
ax.scatter(x, y, alpha=0.5)  # alpha是设置透明度,这样点重合时看的明显

# 设置标题,标签
ax.set(title='散点图', xlabel='各项贷款余额',ylabel='不良贷款(亿元)')

# 显示图形
plt.show()
【附件】文件data.csv
年份,人均GDP(元),啤酒产量(万千升),居民消费价格指数(上面=100)
2000,7857.7,2231.3,100.4
2001,8621.7,2288.9,100.7
2002,9398.1,2402.7,99.2
2003,10542,2540.5,101.2
2004,12335.6,2948.6,103.9
2005,14185.4,3126.1,101.8
2006,16499.7,3543.58,101.5
2007,20169.5,3954.07,104.8
2008,23707.7,4156.91,105.9
2009,25607.5,4162.18,99.3
2010,30015,4490.16,103.3
2011,35197.8,4834.5,105.4
2012,38549.5,4778.58,102.6
2013,41907.6,5061.5,102.6
文件BankData.csv
分行编号,不良贷款(亿元),各项贷款余额,本年累计应收贷款(亿元),贷款项目个数,本年固定资产投资额(亿元)
1,0.9,67.3,6.8,5,51.9
2,1.1,111.3,19.8,16,90.9
3,4.8,173,7.7,17,73.7
4,3.2,80.8,7.2,10,14.5
5,7.8,199.7,16.5,19,63.2
6,2.7,16.2,2.2,1,2.2
7,1.6,107.4,10.7,17,20.2
8,12.5,185.4,27.1,18,43.8
9,1,96.1,1.7,10,55.9
10,2.6,72.8,9.1,14,64.3
11,0.3,64.2,2.1,11,42.7
12,4,132.2,11.2,23,76.7
13,0.8,58.6,6,14,22.8
14,3.5,174.6,12.7,26,117.1
15,10.2,263.5,15.6,34,146.7
16,3,79.3,8.9,15,29.9
17,0.2,14.8,0.6,2,42.1
18,0.4,73.5,5.9,11,25.3
19,1,24.7,5,4,13.4
20,6.8,139.4,7.2,28,64.3
21,11.6,368.2,16.8,32,163.9
22,1.6,95.7,3.8,10,44.5
23,1.2,109.6,10.3,14,67.9
24,7.2,196.2,15.8,16,39.7
25,3.2,102.2,12,10,97.1


