Elastic:Elastic Security 入门
Elastic 安全是在 Elastic Stack 上构建对所有人的统一保护。Elastic Security 使分析人员能够预防,检测和响应威胁。 这个免费开放的解决方案可提供SIEM,端点安全,威胁搜寻,云监视等功能。Elastic Security 由以下的两个部分组成:

在上面 Security app 指的就是在 Kibana 中的 SIEM 应用,而 Endpoint 指的就是一个安装于你系统之上的一个端点代理。通过这两个部件的组合,它可以帮安全专家解决 SIEM, 端点安全, 威胁搜寻、云监测及其它的安全使用案例等功能。Elastic Security 的真正作用就是保护我们的数据免受不被允许的用户所访问:

此外,Elastic security有一个不断扩展的集成列表,可以从你的网络中摄取任何数据源。Elastic Security 是构建于 Elastic Stack 之上的:

这也就是说,Elastic Securty 可以充分享有 Elasticsearch 所带来的快速搜索,易于扩展以及相关性。你不需要做任何额外的开发和微调就可以享受 Elastic Stack 所带来的好处。
在今天的展示中,我们将给大家展示如果使用 Elastic Security 自带的安全模块,并对一个极有可能产生安全隐患的操作进行捕获。我将在 Windows 下安装 endpoint agent。整个系统的组成如下:

如上图所示,我把 Elastic Stack 安装于一个 MacOS 的机器上。它含有一个 IP 地址为 192.168.0.3。在一个虚拟机里,我安装了 Windows 10,它可以直接访问 MacOS。
C:\WINDOWS\system32> ping mac

正在 Ping Mac [192.168.0.3] 具有 32 字节的数据:
来自 192.168.0.3 的回复: 字节=32 时间<1ms TTL=128
来自 192.168.0.3 的回复: 字节=32 时间<1ms TTL=128

192.168.0.3 的 Ping 统计信息:
    数据包: 已发送 = 2,已接收 = 2,丢失 = 0 (0% 丢失),
往返行程的估计时间(以毫秒为单位):
    最短 = 0ms,最长 = 0ms,平均 = 0ms
在今天的展示中,我将使用 Elastic Stack 7.10 来进行展示。
安装
Elastic Stack
如果你还没有安装自己的 Elasticsearch 以及 Kibana 的话,那么请参照我之前的文章 “Elastic:菜鸟上手指南” 来分别进行安装。为了能够使得我们的 Elastic Stack 被安装于另外一台机器上的 Endpoint agent 所访问,我们必须对 Elasticsearch 以及 Kibana 的配置做相应的调整。
针对 Elasticsearch,我们需要作如下的调整:
config/elasticsearch.yml
network.host: 0.0.0.0
discovery.type: single-node
xpack.security.enabled: true
xpack.security.authc.api_key.enabled: true
我们设置 network.host: 0.0.0.0 是为了使得 Elasticsearch 绑定于所有的网络接口上,从而 localhost:9200 以及 mac:9200 都可以被正确访问。这里 mac 的地址被设置为 MacOS 电脑的私有地址 192.168.0.3。由于 endpoint agent 的引入,我们需要 super 用户 elastic 才可以进行配置,所以我们必须启动安全设置。如果大家想了解如何配置安全,请参阅我之前的文章 “Elasticsearch:设置 Elastic 账户安全”。为了说明问题的方便,我们设置 Elasticsearch 的密码为 password。
针对 Kibana,我们也需要做相应的调整:
config/kibana.yml
server.host: "mac"
elasticsearch.username: "kibana_system"
elasticsearch.password: "password"
xpack.security.enabled: true
xpack.fleet.agents.tlsCheckDisabled: true
xpack.encryptedSavedObjects.encryptionKey: "something_at_least_32_characters"
在上面,mac 表示的是 MacOS 电脑的 IP 地址。在上面的最后几个设置是为了配合 ingest manager 能够正常使用而设置的。这个在之前的文章 “Observability:使用 Elastic Agent 和 Ingest Manager 简化数据导入” 已经讲过了。
好了,我们对 Elasticsearch 已经 Kibana 的配置已经完成。重新启动 Elasticsearch 及 Kibana。我们需要使用用户名及密码来登录 Kibana。
安装 endpoint agent
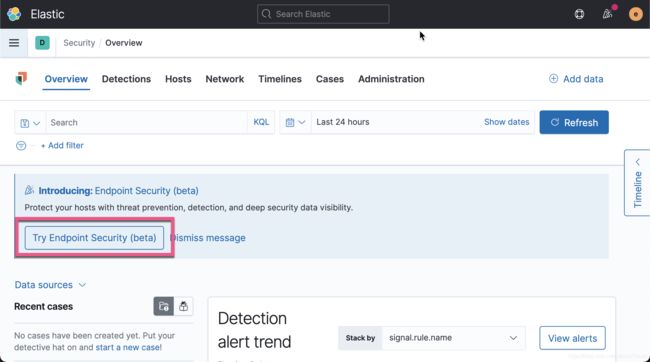
Kibana 提供了很多很多可以供我们方便安装安全数据来源的列表:


在上面,我们已经列出了一个丰富的列表俩展示如何摄入我们需要的安全数据。
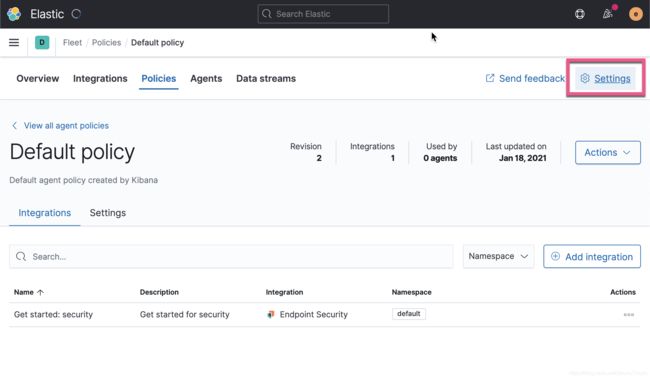
针对我们的安全检测,我们使用如下的方法来安装 endpoint agent 到 Windows OS 之上。


为了能够正确地配置我们的 endpoint,我们必须调整一下设置:


我们按照上面的命令去下载页面下载 Elastic agent。由于我们是要安装到 Windows 操作系统上的,所以我们下载 Windows 的版本。然后安装上面的命令来进行安装:
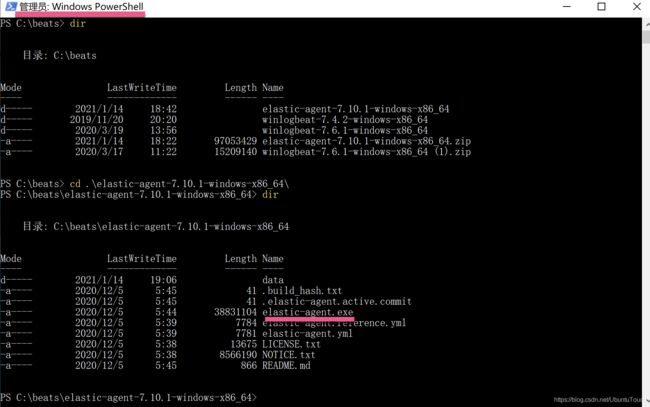

针对我的情况,我添加了 --insecure 这个选项来启动 elastic agent。上面的命令将会启动 elastic-agent 作为一个服务。它将被安装于如下的这个目录:

如果你不需要这个服务的话,你可以通过如下的命令来卸载这个服务:
.\elastic-agent.exe uninstall在上面我们已经在 Windows 下成功地安装了 elastic agent。我们切换到 Mac OS 的 Kibana 上去观看:
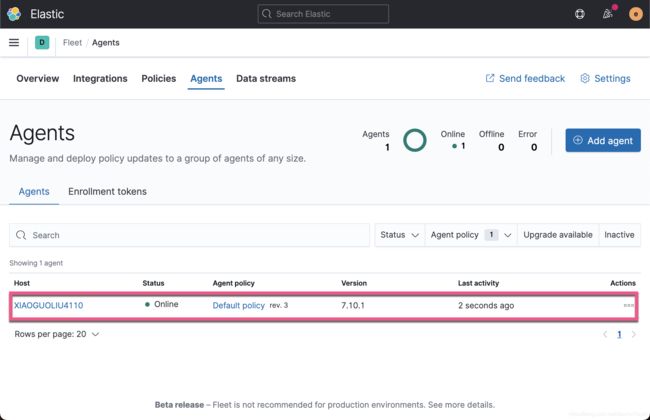
上面显示有一台已经成功连接的 Windows 机器。我们点击 Data streams:

我们可以看到不同的 data streams。我们切换到 Security Overview 的页面,你可以看到有很多的 Events 已经进入到 Elasticsearch 了。

如果你能看到上面的这些,那么说明你的安装是没有任何的问题的。在接下来的内容里,我将来展示如何使用 Elastic Security 来捕获一个模拟的可能对你电脑有威胁的事件。
捕获安全事件
在这节中,我们想通过在 Windows 电脑上的一些操作,而这这些操作可能会对电脑的安全产生影响。我们想在 Elastic Security 中查看到这些事件。
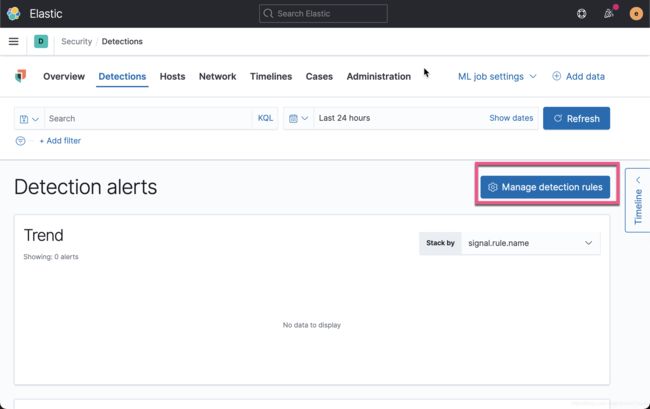
首先,我们打开 Kibana 的 Security/Detections。目前我们可以看到如下的画面:

从上面可以看出来,这里没有任何的被侦测到的事件。我们到 Windows 的 Powershell 中打入如下系列的命令:
cmd.exe
powershell.exe
tasklist
whoami
上面的命令系列是一个典型的具有威胁的应用通常需要执行的步骤,运行自己的脚本。在我们执行完上面的命令后,我们重新回到 Security/Detections 页面 。我们看到的页面和之前显示的是没有任何的区别。说明在不做任何事情的前提下,Elastic Security 不具有任何的侦测威胁的能力。我们需要做如下的操作:
在上面,我们点击 Manage detection rules。通过这个步骤,我们加载 Elastic 已经为我们做好的许多的检查的规则。这些规则可以帮助我们检测许多可能对我们电脑有威胁的行为:

我们展示所有的规则:

我们启动所有的检测:

上面显示,有36个规则需要机器学习才可以启动检测。我们可以启动白金版试用。然后再来运行:

启动白金版试用后,再次重新启动这些规则。我们就会发现没有之前的那个警告。
接下来,我们在 Windows 电脑的 Powershell 中,重新打入如下的命令:
cmd.exe
powershell.exe
tasklist
whoami
等过一会儿,我们就会发现:

有一个事件被侦测出来了。它表明有一个潜在的威胁。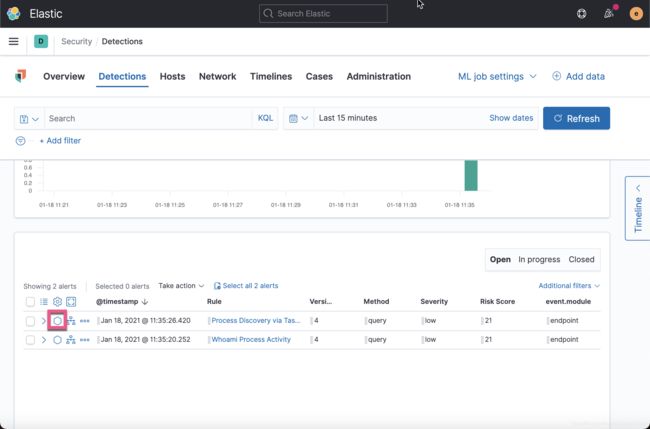

从上面我们可以看到一个被检测到的可能导致威胁的命令执行顺序。

我们点击上年的事件,我们可以得到更多的关于这个事件的信息。
我们甚至可以直接对这个事件进行 timeline 分析,并添加 notes:

我们可以在 Timelines 中找到这个 timeline:

当然,你可以针对 Detections 中的其它事件来进行分析,比如 whoami 命令:

好了,今天的展示就先讲到这里。如果你对 Elastic Security 感兴趣的话,你可以找到更多的文章 “Elastic:菜鸟上手指南”。请搜索 SIEM 及 Endpoint Security。