目标检测(二)——锚框总结与代码实现(可完整实现)
文章目录
- 锚框的含义
- 代码实践
-
- 0. 导入的基本库
- 1. anchor_box的表示
- 2. 绘制边界框矩形
- 3. 绘制锚框的方法
- 4. 单个锚框的演示代码
-
- 结果图片
- 5. 给整张图片绘制锚框
-
- 结果图片
锚框的含义
锚框: 一种假象的框,提前人为设定——通常是在每个像素中心点绘制一定数量的不同长宽比的锚框。(不是真实框,是模型预测时需要的一种预置框)
锚框的数据格式与 边界框是一样的, 通常也有两种形式; xyxy, xywh。
下面是锚框在指定的一个像素中心上的绘制效果:
接下来,我们用代码来构建这个锚框的绘制!
代码实践
0. 导入的基本库
import numpy as np  # 可能用到的数据值计算库
import os           # 可能用到的文件操作
import matplotlib.pyplot as plt   		# 图形绘制
import matplotlib.patches as patches 	# 添加矩形框
import matplotlib.image as image  		# 读取图像数据
1. anchor_box的表示
这里与bounding box的表示是一样的!
def BoundingBox_Denote(bbox=[], mode=True):
    '''边界框的表示形式的转换
        bbox: 包含(x1, y1, x2, y2)四个位置信息的数据格式
        mode: 边界框数据表示的模式
             True:  to (x1,y1,x2,y2)
             False: to (x,y,w,h)

        return: 返回形式转换后的边界框数据
    '''
    denote_bbox = [] # 转换表示的边界框

    if mode is True:  # 保持原形式
        denote_bbox = bbox
    else:  # 转换为(center_x, center_y, w, h)
        center_x = (bbox[0]+bbox[2]) / 2.0
        center_y = (bbox[1]+bbox[3]) / 2.0
        w = bbox[2] - bbox[0]
        h = bbox[3] - bbox[1]
        denote_bbox = [center_x, center_y, w, h]

    # 返回表示转换的边界框表示
    denote_bbox = np.asarray(denote_bbox,  dtype='float32')
    return denote_bbox
2. 绘制边界框矩形
定义绘制矩形的函数——与boungding box的矩形绘制一样!
def draw_rectangle(bbox=[], mode=True, color='k', fill=False):
    '''绘制矩形框
        bbox:边界框数据(默认框数据不超过图片边界)
        mode: 边界框数据表示的模式
             True:  to (x1,y1,x2,y2)
             False: to (x,y,w,h)
        color: 边框颜色
        fill: 是否填充
    '''
    if mode is True: # to (x1,y1,x2,y2)
        x = bbox[0]
        y = bbox[1]
        w = bbox[2] - bbox[0] + 1  # 考虑到实际长度由像素个数决定,因此加1(可按坐标轴上两点间的点数推导)
        h = bbox[3] - bbox[1] + 1
    else: # to (x,y,w,h)
    	# 默认绘制的框不超出边界
        x = bbox[0] - bbox[2] / 2.0
        y = bbox[1] - bbox[3] / 2.0
        w = bbox[2]
        h = bbox[3]

    # 绘制边界框
    # patches.Rectangle需要传入左上角坐标、矩形区域的宽度、高度等参数
    # 获取绘制好的图形的返回句柄——用于添加到当前的图像窗口中
    rect = patches.Rectangle((x, y), w, h,
                             linewidth=1,        # 线条宽度
                             edgecolor=color,    # 线条颜色
                             facecolor='y',      #
                             fill=fill, linestyle='-')

    return rect
3. 绘制锚框的方法
相比于bounding box,anchor box主要在于是以某一个像素点为中心进行多个框的绘制——通常为3个。
def draw_anchor(ax, center, length, scales, ratios, img_height, img_width, color='r'):
    '''绘制锚框————同一中心点三个不同大小的锚框
        ax: plt的窗体句柄——用于调用矩形绘制
        center:中心点坐标
        length:基本长度
        scales:尺寸
        ratios:长宽比
        img_height: 图片高
        img_width: 图片宽

        一个锚框的大小,由基本长度+尺寸+长宽比有关
        同时锚框的最终计算值与图片实际大小有关——不能超过图片实际范围嘛
    '''

    bboxs = []  # 这里的边界框bbox是指的锚框

    for scale in scales: # 遍历尺寸情况
        for ratio in ratios: # 同一尺寸下遍历不同的长宽比情况
            # 利用基本长度、尺寸与长宽比进行锚框长宽的转换
            h = length * scale * np.math.sqrt(ratio)
            w = length * scale / np.math.sqrt(ratio)
            # 利用求得的长宽,确定绘制矩形需要的左上角顶点坐标和右下角顶点坐标
            # 不同的绘制API可能有不同的参数需要,相应转换即可
            x1 = max(center[0] - w / 2., 0.)  # 考虑边界问题
            y1 = max(center[1] - h / 2., 0.)
            x2 = min(center[0] + w / 2. - 1.0, img_width - 1.)  # center[0] + w / 2 -1.0 是考虑到边框不超过边界
            y2 = min(center[1] + h / 2. - 1.0, img_height - 1.)

            bbox = [x1, y1, x2, y2]
            print('An Anchor: ', bbox)
            bboxs.append(bbox)  # 押入生成的anchor

    for bbox in bboxs:

        denote_mode = True  # 当前的目标数据形式: True: (x1, y1, x2, y2)
        denote_bbox = BoundingBox_Denote(bbox=bbox, mode=denote_mode)

        # 绘制anchor的矩形框
        rect = draw_rectangle(bbox=denote_bbox, mode=True, color=color)

        ax.add_patch(rect)
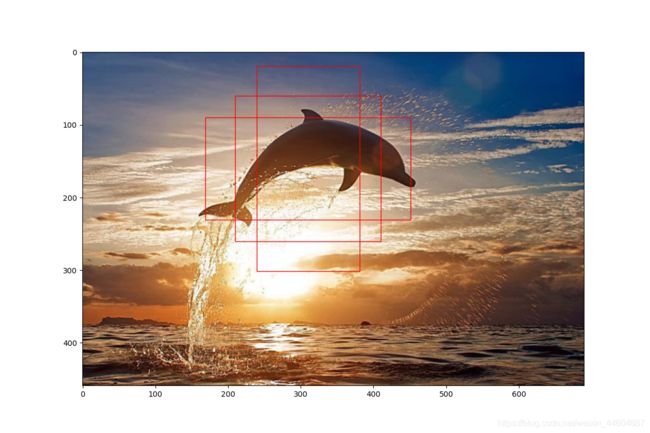
4. 单个锚框的演示代码
# 先读取图像,再绘制
fig = plt.figure(figsize=(12, 8))
ax = plt.gca()

# 图片路径
img_path = os.path.join(os.getcwd(), 'img', '1.jpg')
img = image.imread(img_path) # 读取图片数据
plt.imshow(img)  # 展示图片
print(img.shape[0])
print(img.shape[1])

# center: [310, 160]
draw_anchor(ax=ax, center=[310, 160],
			length=200, scales=[1.0], ratios=[0.5, 1.0, 2.0],
			img_height=img.shape[0], img_width=img.shape[1],
			color='r')

plt.show()
结果图片

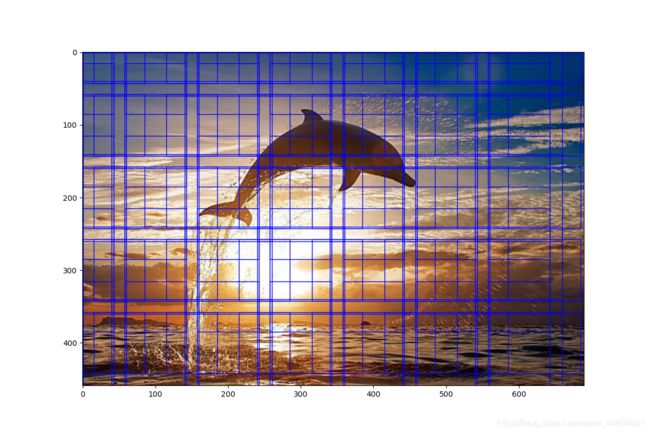
5. 给整张图片绘制锚框
这里按照一定的间隔取像素中心进行锚框的绘制!
    # 先读取图像,再绘制
    fig = plt.figure(figsize=(12, 8))
    ax = plt.gca()

    # 图片路径
    img_path = os.path.join(os.getcwd(), 'img', '1.jpg')
    img = image.imread(img_path) # 读取图片数据
    plt.imshow(img)  # 展示图片
    print(img.shape[0])
    print(img.shape[1])

    # # center: [310, 160]
    # draw_anchor(ax=ax, center=[310, 160],
    #             length=200, scales=[1.0], ratios=[0.5, 1.0, 2.0],
    #             img_height=img.shape[0], img_width=img.shape[1],
    #             color='b')

    # # center: [200, 200]
    # draw_anchor(ax=ax, center=[200, 200],
    #             length=100, scales=[1.0], ratios=[0.5, 1.0, 2.0],
    #             img_height=img.shape[0], img_width=img.shape[1],
    #             color='r')

    # 每间隔100个像素上绘制三个基本长度为120的锚框
    for i in range(0, img.shape[0], 100):  # y值
        for j in range(0, img.shape[1], 100): # x值
            # center: x, y
            y = i
            x = j
            draw_anchor(ax=ax, center=[x, y],
                        length=120, scales=[1.0], ratios=[0.5, 1.0, 2.0],
                        img_height=img.shape[0], img_width=img.shape[1],
                        color='b')

    plt.show()
结果图片
相关链接(持续更新)
目标检测(一)——边界框总结与代码实现(可完整实现)
目标检测(三)——IoU总结与代码实现(可完整实现)