模式识别与机器学习作业——人脸识别与检测(Python实现)
PR&ML Project Description -Project 1
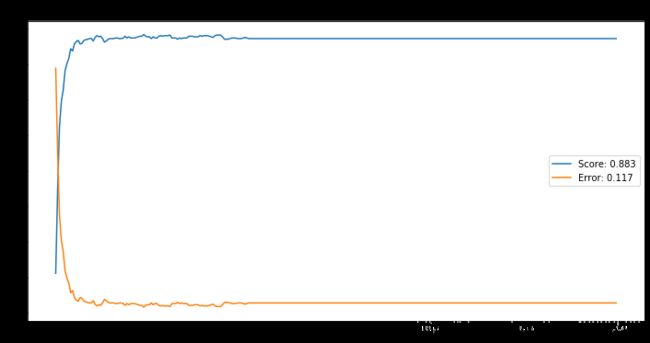
1-The report
The answer can be seen in the code.
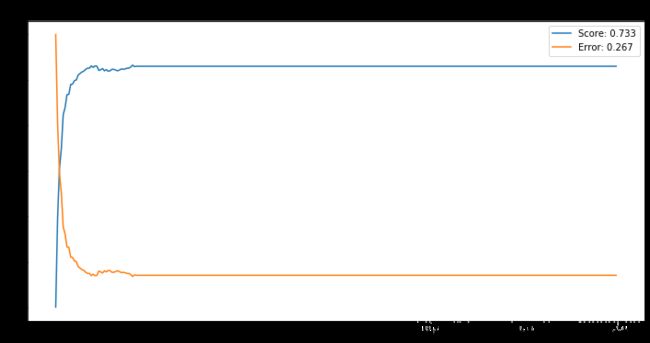
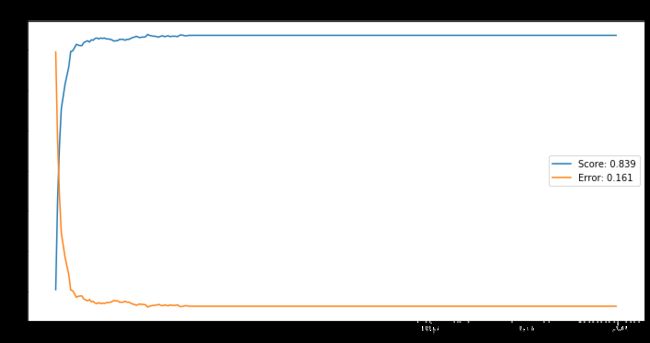
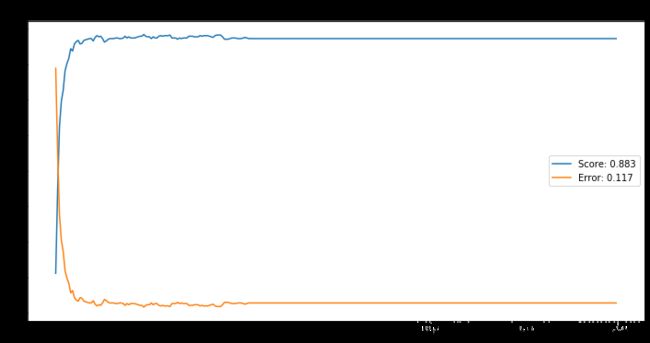
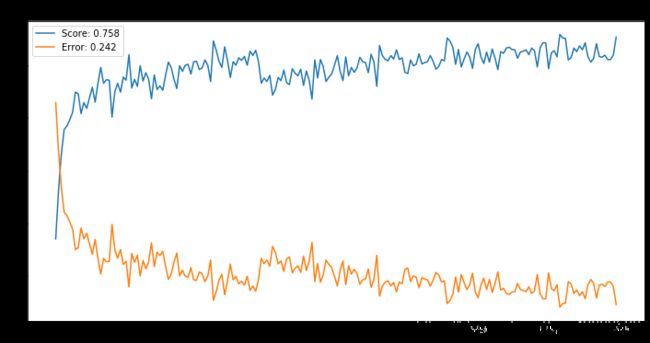
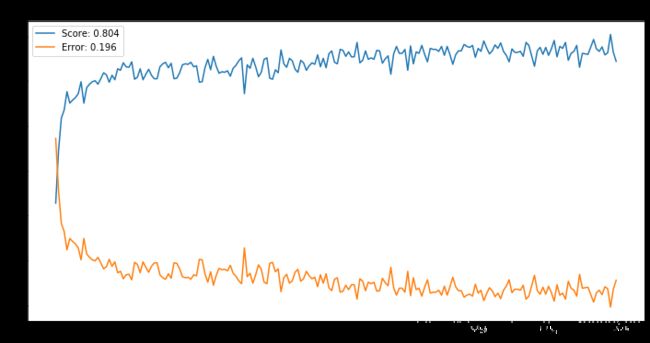
(3) Let N = 5 and 7, respectively. Repeat (2) for each N.
N = 5:
N=7:
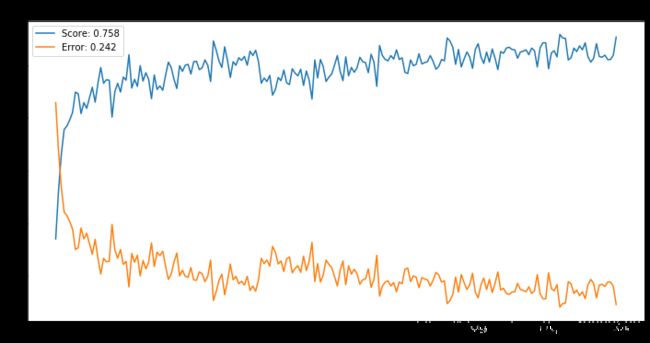
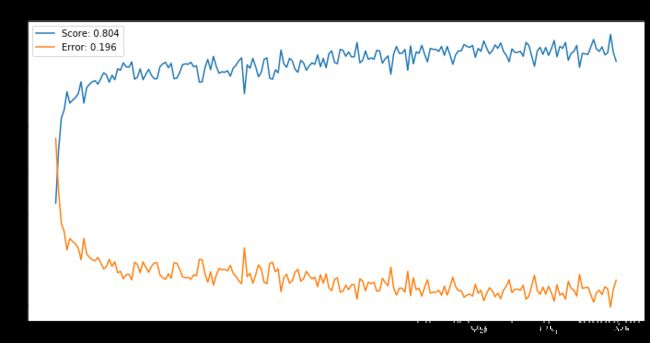
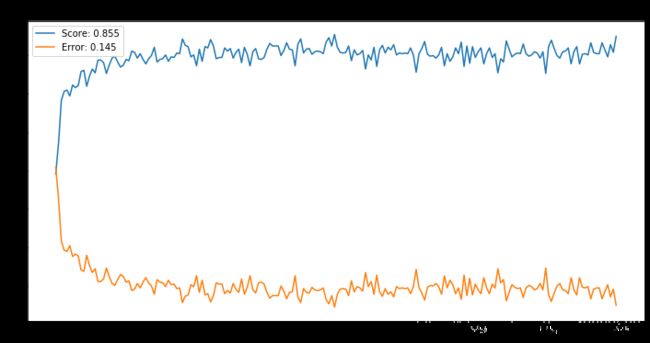
(4) Repeat (2) and (3) for Fisherfaces. Compare the simulation results of Eigenfaces and Fisher-faces, and describe your findings.
N = 3:
N = 5:
N = 7:
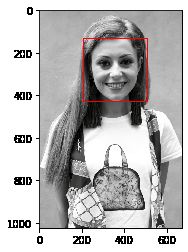
There I cover face detection using :
- Haar Cascade Classifiers using OpenCV
- Histogram of Oriented Gradients using Dlib
1. Cascade Classifiers
Cascade classifier, or namely cascade of boosted classifiers working with haar-like features, is a special case of ensemble learning, called boosting. It typically relies on Adaboost classifiers (and other models such as Real Adaboost, Gentle Adaboost or Logitboost). Cascade classifiers are trained on a few hundred sample images of image that contain the object we want to detect, and other images that do not contain those images.
How can we detect if a face is there or not ? There is an algorithm, called Viola–Jones object detection framework, that includes all the steps required for live face detection :
- Haar Feature Selection, features derived from Haar wavelets
- Create integral image
- Adaboost Training
- Cascading Classifiers
The original paper was published in 2001.
1.1 Haar Feature Selection
There are some common features that we find on most common human faces :
- A dark eye region compared to upper-cheeks
- A bright nose bridge region compared to the eyes
- Some specific location of eyes, mouth, nose
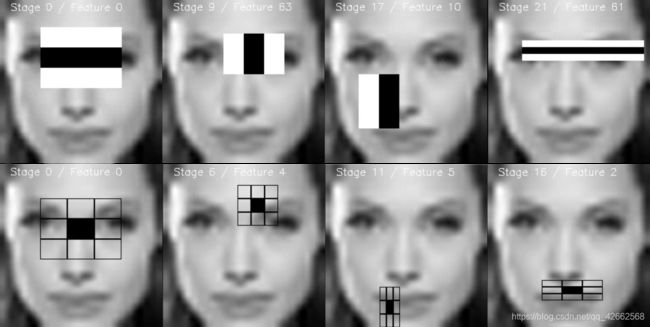
The characteristics are called Haar Features. The feature extraction process will look like this :
In this example, the first feature measures the difference in intensity between the region of the eyes and a region across the upper cheeks. The feature value is simply computed by summing the pixels in the black area and subtracting the pixels in the white area.
Then, we apply this rectangle as a convolutional kernel, over our whole image. In order to be exhaustive, we should apply all possible dimensions and positions of each kernel. A simple 24*24 images would typically result in over 160’000 features, each made of a sum/subtraction of pixels values. It would computationally be impossible for live face detection. So, how do we speed up this process ?
- once the good region has been identified by a rectangle, it is useless to run the window over a completely different region of the image. This can be achieved by Adaboost.
- compute the rectangle features using the integral image principle, which is way faster. We’ll cover this in the next section.
Now that the features have been selected, we apply them on the set of training images using Adaboost classification, that combines a set of weak classifiers to create an accurate ensemble model. With 200 features (instead of 160’000 initially), an accuracy of 95% is achieved. The authors of the paper have selected 6’000 features.
Integral Image:
To quote an answer on quora - https://www.quora.com/How-integral-image-is-used-in-image-processing-and-how-improves-the-computation-time
Integral image is an image we get by cumulative addition of intensities on subsequent pixels in both horizontal and vertical axis.
In image processing, we generally rely on features specific to certain regions of the entire image. Hence, we need properties of those specific regions
Adaboost algorithm:
The above algorithm shows the steps taken to choose the appropriate classifiers
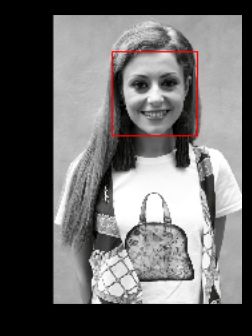
1.2 The result
| one face | zero face | zero face |
|---|---|---|
 |
 |
 |
2. Histogram of Oriented Gradients (HOG) in Dlib
One of the most popular implement for face detection is offered by Dlib and uses a concept called Histogram of Oriented Gradients (HOG). This is an implementation of the original paper by Dalal and Triggs - https://lear.inrialpes.fr/people/triggs/pubs/Dalal-cvpr05.pdf
The model is built out of 5 HOG filters – front looking, left looking, right looking, front looking but rotated left, and a front looking but rotated right. The model comes embedded in the header(https://github.com/davisking/dlib/blob/master/dlib/image_processing/frontal_face_detector.h) file itself.
The dataset used for training, consists of 2825 images which are obtained from LFW dataset and manually annotated by Davis King, the author of Dlib. It can be downloaded from here - http://vis-www.cs.umass.edu/lfw/.
The idea behind HOG is to extract features into a vector, and feed it into a classification algorithm like a Support Vector Machine for example that will assess whether a face (or any object you train it to recognize actually) is present in a region or not.
The features extracted are the distribution (histograms) of directions of gradients (oriented gradients) of the image. Gradients are typically large around edges and corners and allow us to detect those regions.
In the original paper, the process was implemented for human body detection, and the detection chain was the following :
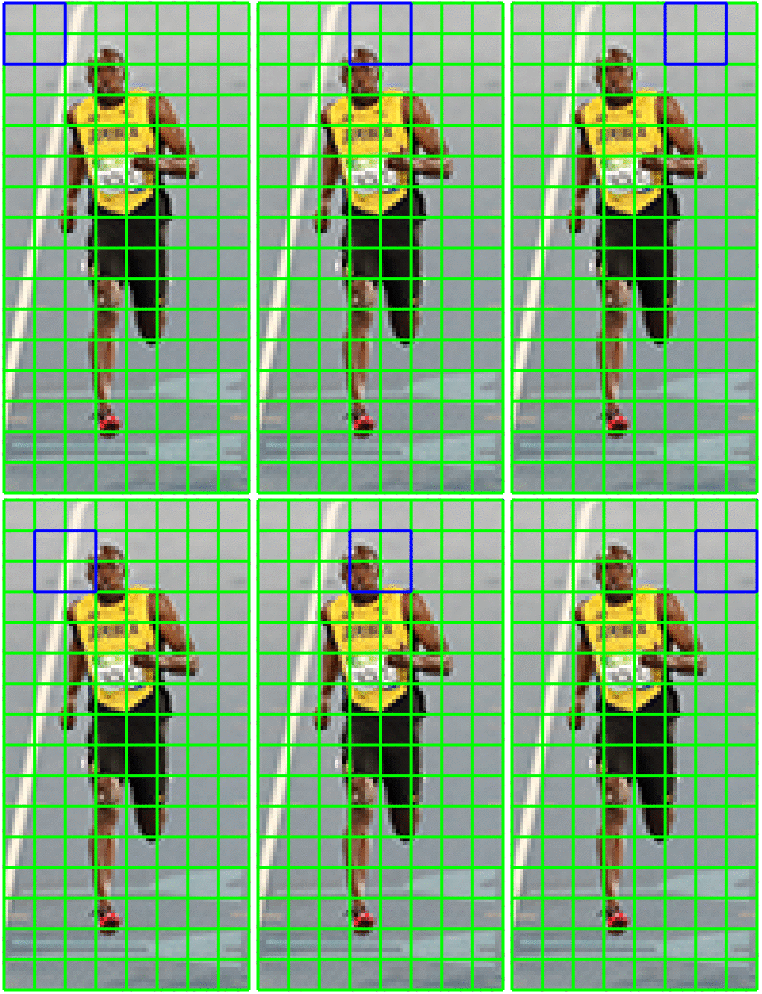
The image is then divided into 8x8 cells to offer a compact representation and make our HOG more robust to noise. Then, we compute a HOG for each of those cells.
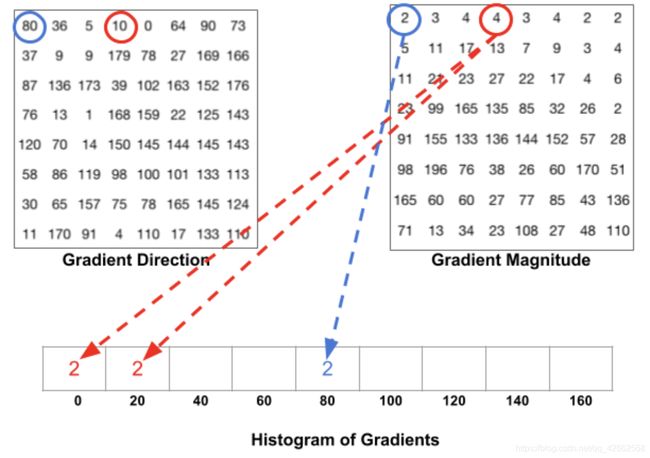
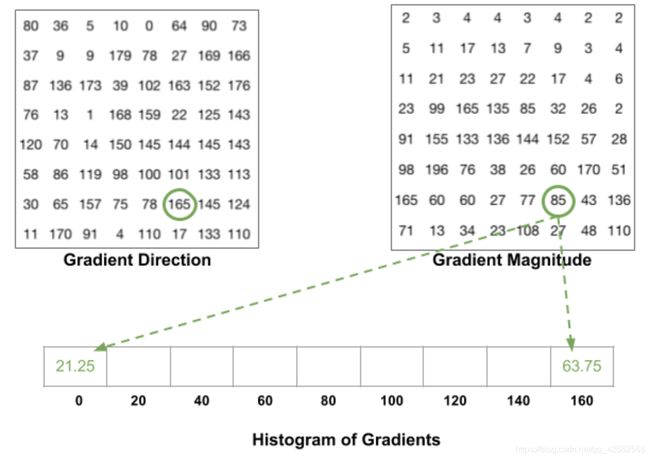
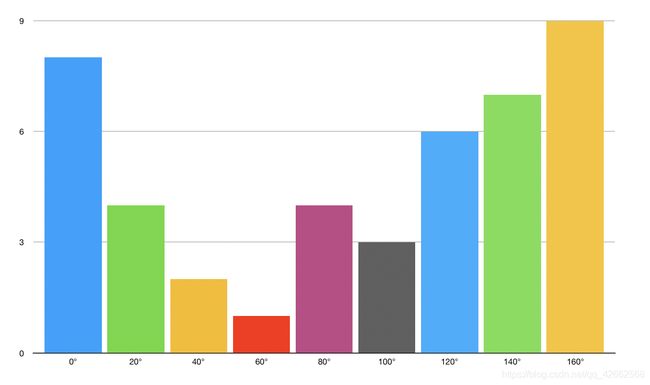
To estimate the direction of a gradient inside a region, we simply build a histogram among the 64 values of the gradient directions (8x8) and their magnitude (another 64 values) inside each region. The categories of the histogram correspond to angles of the gradient, from 0 to 180°. Ther are 9 categories overall : 0°, 20°, 40°… 160°.
We then calculate 2 information :
- Direction of the gradient
- Magnitude of the gradient
When we build the HOG, there are 3 subcases :
- The angle is smaller than 160° and not halfway between 2 classes. In such case, the angle will be added in the right category of the HOG
- The angle is smaller than 160° and exactly between 2 classes. In such case, we consider an equal contribution to the 2 nearest classes and split the magnitude in 2
- the angle is larger than 160°. In such case, we consider that the pixel contributed proportionally to 160° and to 0°.
The HOG looks like this for each 8x8 cell :
2.2 Block normalization
Finally, a 16x16 block can be applied in order to normalize the image and make it invariant to lighting for example. This is simply achieved by dividing each value of the HOG of size 8x8 by the L2-norm of the HOG of the 16x16 block that contains it, which is in fact a simple vector of length 9*4 = 36.
Finally, all the 36x1 vectors are concatenated into a large vector. And we are done ! We have our feature vector, on which we can train a soft SVM classifier.
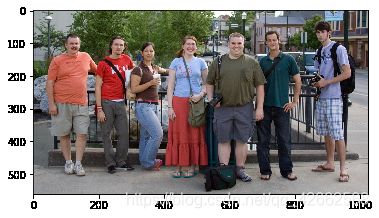
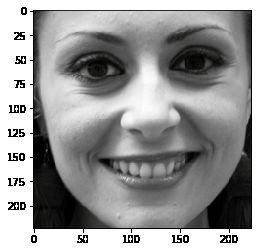
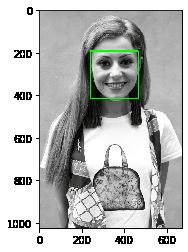
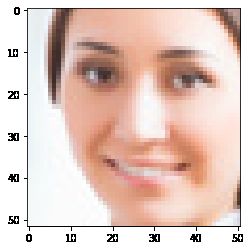
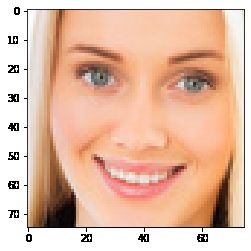
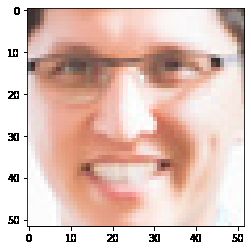
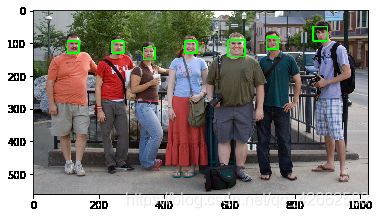
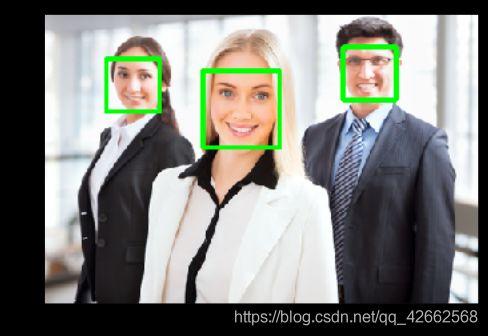
2.3 The result
| one face | three faces | seven faces |
|---|---|---|
 |
 |
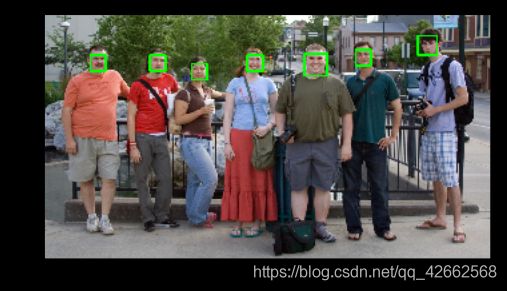 |
We can clearly see that the result of Histogram of Oriented Gradients using Dlib is better than Haar Cascade Classifiers using OpenCV there.
2- The code
2-1 Face recognition
Eigenfaces
import numpy as np
import pandas as pd
import os
import random
import imageio
import matplotlib.pyplot as plt
from collections import Counter
import  copy
%matplotlib inline
# 加上这两行可以一次性输出多个变量而不用print
from IPython.core.interactiveshell import InteractiveShell
InteractiveShell.ast_node_interactivity = "all"
# 显示灰度图
def showGray(img):
    plt.imshow(img, cmap='gray')
    plt.show()
# 读取文件夹,返回文件地址列表
def readImage(foderName):
    addr = []
    for filename in os.listdir(foderName):
        addr.append(foderName + '/' + filename)
    return addr
# 标签列表
nameList = [
    '01', '02', '03', '04', '05', '06', '07', '08', '09', '10', '11', '12',
    '13', '14', '15'
]
# 特征列表
characteristic = [
    'centerlight', 'glasses', 'happy', 'leftlight', 'noglasses', 'normal', 'rightlight',
    'sad', 'sleepy', 'surprised', 'wink'
]
# 读取图片并划分数据集为训练集和测试集
path = './project1-data-Recognition/subject'
def train_test_split(N):

    index = random.sample(range(0,11), N)
    temp = np.arange(11).tolist()
    index_ = list(set(index)^set(temp))

    x_train = []
    x_test = []
    y_train = []
    y_test = []

    for name in nameList:
        for character in [characteristic[i] for i in index]:
            src = path + name + '.' + character + '.pgm'
            img = imageio.imread(src)
            x_train.append(img)

        for character in [characteristic[i] for i in index_]:
            src = path + name + '.' + character + '.pgm'
            img = imageio.imread(src)
            x_test.append(img)

        for i in range(N):
            y_train.append(int(name))
        for j in range(N,11):
            y_test.append(int(name))
    return x_train, x_test, y_train, y_test
# 进行10次试验取平均
N = 7 # 设置N值
try_nums = 10
x_trains = []
x_tests = []
for _ in range(try_nums):
    x_train, x_test, y_train, y_test = train_test_split(N)
    x_trains.append(x_train)
    x_tests.append(x_test)
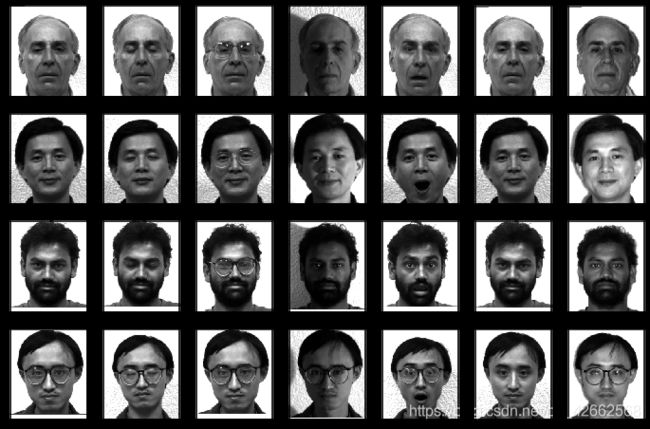
# 画出前4组人脸图像
# 创建画布和子图对象
fig, axes = plt.subplots(4,N
                       ,figsize=(12,8)
                       ,subplot_kw = {
     "xticks":[],"yticks":[]} #不要显示坐标轴
                       )
#填充图像
for i, ax in enumerate(axes.flat):
    ax.imshow(x_trains[0][i+4*N],cmap="gray") #选择色彩的模式
# 进行特征降采样, 采样间隔为4
x_train_downs = copy.deepcopy(x_trains)
x_test_downs = copy.deepcopy(x_tests)
for i in range(try_nums):
    for j in range(len(x_train_downs[0])):
        x_train_downs[i][j] = x_trains[i][j][::2,::2]
    for j in range(len(x_test_downs[0])):
        x_test_downs[i][j] = x_tests[i][j][::2,::2]
print("============training data============")
print("降采样特征前:")
x_trains[0][0].shape
print("降采样特征后:")
x_train_downs[0][0].shape

print("==============test data==============")
print("降采样特征前:")
x_tests[0][0].shape
print("降采样特征后:")
x_test_downs[0][0].shape
============training data============
降采样特征前:

(231, 195)

降采样特征后:

(116, 98)

==============test data==============
降采样特征前:

(231, 195)

降采样特征后:

(116, 98)
# 图像数据转换特征矩阵
train_lts = []
test_lts = []
for i in range(try_nums):
    x_train_down_mat = []
    x_test_down_mat = []
    for image in x_train_downs[i]:
        data = image.flatten()
        x_train_down_mat.append(data)
    train_lts.append(x_train_down_mat)

    for image in x_test_downs[i]:
        data = image.flatten()
        x_test_down_mat.append(data)
    test_lts.append(x_test_down_mat)

len(train_lts)
train_lts[1][1].shape
10

(11368,)
# 转换为numpy数组
x_train_arr = np.array(train_lts)
y_train_arr = np.array(y_train)
x_train_arr.shape

x_test_arr = np.array(test_lts)
y_test_arr = np.array(y_test)
x_test_arr.shape
(10, 105, 11368)

(10, 60, 11368)
# 平均脸
means = []
for i in range(try_nums):
    means.append(np.mean(x_train_arr[i], axis=0).reshape(x_train_downs[0][0].shape))
# 画出平均脸
# 创建画布和子图对象
fig, axes = plt.subplots(1,10
                       ,figsize=(16,8)
                       ,subplot_kw = {
     "xticks":[],"yticks":[]} #不要显示坐标轴
                       )
#填充图像
for i, ax in enumerate(axes.flat):
    ax.imshow(means[i],cmap="gray") #选择色彩的模式
class PCA:
    def __init__(self):
        self.x_train_fit = None
        self.y_train_fit = None
        self.U = None
        self.S = None
        self.V = None

    def fit(self, x_train, y_train):
        self.x_train_fit = x_train
        self.y_train_fit = y_train
        return self

    # 数据标准化
    def Centralization(self, X):
        Centra = X - np.mean(self.x_train_fit, axis=0)
        return Centra

    def model(self):
        #定义一个新矩阵
        X_ = (1 / np.sqrt(len(self.Centralization(
            self.x_train_fit)))) * self.Centralization(self.x_train_fit)
        #进行奇异值分解
        self.U, self.S, self.V = np.linalg.svd(X_)

    def transform(self, X, K):
        X = self.Centralization(X)
        X_dunction = (((self.V).T[:, :K]).T).dot(X.T).T
        return X_dunction
pca = PCA()
resultTrain = []
resultTest = []
for i in range(try_nums):
    pca.fit(x_train_arr[i], y_train_arr)
    pca.model()
    X1 = []
    X2 = []
    for j in range(1,301):
        xTrain_i = pca.transform(x_train_arr[i], j)
        X1.append(xTrain_i)
        xTest_i = pca.transform(x_test_arr[i], j)
        X2.append(xTest_i)
    resultTrain.append(X1)
    resultTest.append(X2)
class KNN:
    def __init__(self, X_train, y_train, n_neighbors=3, p=2):
        """
        n_neighbors: 临近点个数
        p: 距离度量
        """
        self.n = n_neighbors
        self.p = p
        self.X_train = X_train
        self.y_train = y_train

    def predict(self, X):
        # 取出n个点
        knn_list = []
        for i in range(self.n):
            dist = np.linalg.norm(X - self.X_train[i], ord=self.p)
            knn_list.append((dist, self.y_train[i]))

        for i in range(self.n, len(self.X_train)):
            max_index = knn_list.index(max(knn_list, key=lambda x: x[0]))
            dist = np.linalg.norm(X - self.X_train[i], ord=self.p)
            if knn_list[max_index][0] > dist:
                knn_list[max_index] = (dist, self.y_train[i])

        # 统计
        knn = [k[-1] for k in knn_list]
        count_pairs = Counter(knn)
        max_count = sorted(count_pairs.items(), key=lambda x: x[1])[-1][0]
        return max_count

    def score(self, X_test, y_test):
        right_count = 0
        n = 10
        for X, y in zip(X_test, y_test):
            label = self.predict(X)
            if label == y:
                right_count += 1
        return right_count / len(X_test)
# 用KNN分类器进行训练
scores = []
for i in range(try_nums):
    scoreList = []
    for j in range(300):
        clf = KNN(resultTrain[i][j], y_train_arr)
        score = clf.score(resultTest[i][j], y_test_arr)
        scoreList.append(score)
    scores.append(scoreList)
# 计算平均误分率
scoresMean = np.mean(scores, axis=0)
len(scoresMean)
errorMean = 1 - scoresMean
errorMean
300

array([0.78833333, 0.55833333, 0.37666667, 0.305     , 0.27333333,
       0.21833333, 0.19833333, 0.18333333, 0.15666667, 0.16333333,
       0.14333333, 0.13666667, 0.13333333, 0.14333333, 0.14166667,
       0.13333333, 0.13166667, 0.13      , 0.12833333, 0.12833333,
       0.135     , 0.125     , 0.12      , 0.12333333, 0.12166667,
       0.12833333, 0.13833333, 0.135     , 0.13      , 0.12833333,
       0.12833333, 0.12833333, 0.12666667, 0.12666667, 0.12833333,
       0.12833333, 0.12666667, 0.12166667, 0.12666667, 0.12333333,
       0.12666667, 0.12666667, 0.12666667, 0.125     , 0.12333333,
       0.12166667, 0.12166667, 0.11666667, 0.12166667, 0.12333333,
       0.12333333, 0.12833333, 0.12333333, 0.12666667, 0.12666667,
       0.12166667, 0.12      , 0.12166667, 0.12      , 0.12      ,
       0.12      , 0.11833333, 0.12666667, 0.12666667, 0.12666667,
       0.13      , 0.12666667, 0.12833333, 0.12666667, 0.12666667,
       0.12666667, 0.12166667, 0.12166667, 0.12166667, 0.12333333,
       0.12333333, 0.12333333, 0.12      , 0.12166667, 0.12      ,
       0.12      , 0.12      , 0.12166667, 0.12333333, 0.125     ,
       0.12      , 0.11833333, 0.11833333, 0.11833333, 0.12333333,
       0.13      , 0.13      , 0.13      , 0.12833333, 0.12666667,
       0.12666667, 0.12666667, 0.12833333, 0.12833333, 0.12833333,
       0.12666667, 0.125     , 0.12666667, 0.12833333, 0.12833333,
       0.12833333, 0.12833333, 0.12833333, 0.12833333, 0.12833333,
       0.12833333, 0.12833333, 0.12833333, 0.12833333, 0.12833333,
       0.12833333, 0.12833333, 0.12833333, 0.12833333, 0.12833333,
       0.12833333, 0.12833333, 0.12833333, 0.12833333, 0.12833333,
       0.12833333, 0.12833333, 0.12833333, 0.12833333, 0.12833333,
       0.12833333, 0.12833333, 0.12833333, 0.12833333, 0.12833333,
       0.12833333, 0.12833333, 0.12833333, 0.12833333, 0.12833333,
       0.12833333, 0.12833333, 0.12833333, 0.12833333, 0.12833333,
       0.12833333, 0.12833333, 0.12833333, 0.12833333, 0.12833333,
       0.12833333, 0.12833333, 0.12833333, 0.12833333, 0.12833333,
       0.12833333, 0.12833333, 0.12833333, 0.12833333, 0.12833333,
       0.12833333, 0.12833333, 0.12833333, 0.12833333, 0.12833333,
       0.12833333, 0.12833333, 0.12833333, 0.12833333, 0.12833333,
       0.12833333, 0.12833333, 0.12833333, 0.12833333, 0.12833333,
       0.12833333, 0.12833333, 0.12833333, 0.12833333, 0.12833333,
       0.12833333, 0.12833333, 0.12833333, 0.12833333, 0.12833333,
       0.12833333, 0.12833333, 0.12833333, 0.12833333, 0.12833333,
       0.12833333, 0.12833333, 0.12833333, 0.12833333, 0.12833333,
       0.12833333, 0.12833333, 0.12833333, 0.12833333, 0.12833333,
       0.12833333, 0.12833333, 0.12833333, 0.12833333, 0.12833333,
       0.12833333, 0.12833333, 0.12833333, 0.12833333, 0.12833333,
       0.12833333, 0.12833333, 0.12833333, 0.12833333, 0.12833333,
       0.12833333, 0.12833333, 0.12833333, 0.12833333, 0.12833333,
       0.12833333, 0.12833333, 0.12833333, 0.12833333, 0.12833333,
       0.12833333, 0.12833333, 0.12833333, 0.12833333, 0.12833333,
       0.12833333, 0.12833333, 0.12833333, 0.12833333, 0.12833333,
       0.12833333, 0.12833333, 0.12833333, 0.12833333, 0.12833333,
       0.12833333, 0.12833333, 0.12833333, 0.12833333, 0.12833333,
       0.12833333, 0.12833333, 0.12833333, 0.12833333, 0.12833333,
       0.12833333, 0.12833333, 0.12833333, 0.12833333, 0.12833333,
       0.12833333, 0.12833333, 0.12833333, 0.12833333, 0.12833333,
       0.12833333, 0.12833333, 0.12833333, 0.12833333, 0.12833333,
       0.12833333, 0.12833333, 0.12833333, 0.12833333, 0.12833333,
       0.12833333, 0.12833333, 0.12833333, 0.12833333, 0.12833333,
       0.12833333, 0.12833333, 0.12833333, 0.12833333, 0.12833333,
       0.12833333, 0.12833333, 0.12833333, 0.12833333, 0.12833333,
       0.12833333, 0.12833333, 0.12833333, 0.12833333, 0.12833333,
       0.12833333, 0.12833333, 0.12833333, 0.12833333, 0.12833333,
       0.12833333, 0.12833333, 0.12833333, 0.12833333, 0.12833333])
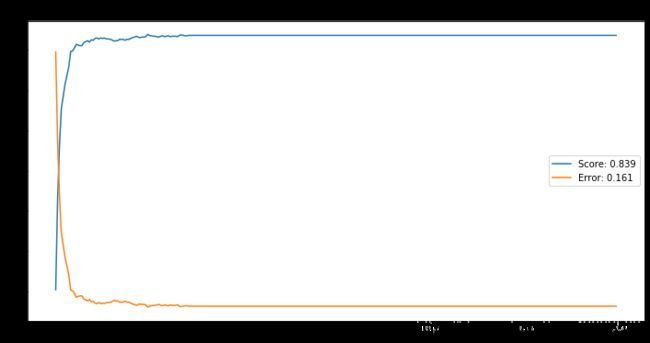
# 画平均误分率曲线
# N = 3
plt.figure(figsize=(12,6))
epochs = range(300)

bestScore = np.max(scoresMean)
bestError = np.min(errorMean)

plt.plot(epochs, scoresMean, label='Score: %0.3f' % bestScore)
plt.plot(epochs, errorMean, label='Error: %0.3f' % bestError)
plt.title('N = 3')
plt.legend()
Text(0.5, 1.0, 'N = 3')
# 画平均误分率曲线
# N = 5
plt.figure(figsize=(12,6))
epochs = range(300)

bestScore = np.max(scoresMean)
bestError = np.min(errorMean)

plt.plot(epochs, scoresMean, label='Score: %0.3f' % bestScore)
plt.plot(epochs, errorMean, label='Error: %0.3f' % bestError)
plt.title('N = 5')
plt.legend()
Text(0.5, 1.0, 'N = 5')
# 画平均误分率曲线
# N = 7
plt.figure(figsize=(12,6))
epochs = range(300)

bestScore = np.max(scoresMean)
bestError = np.min(errorMean)

plt.plot(epochs, scoresMean, label='Score: %0.3f' % bestScore)
plt.plot(epochs, errorMean, label='Error: %0.3f' % bestError)
plt.title('N = 7')
plt.legend()
Text(0.5, 1.0, 'N = 7')
Fisherfaces
# 由以上结果,我这里选pca先降到300维
pca = PCA()
resultTrain = []
resultTest = []
for i in range(try_nums):
    pca.fit(x_train_arr[i], y_train_arr)
    pca.model()

    X1 = pca.transform(x_train_arr[i], 300)
    X2 = pca.transform(x_test_arr[i], 300)

    resultTrain.append(X1)
    resultTest.append(X2)
resultTrain[0].shape
resultTest[0].shape
(105, 300)

(60, 300)
def LDA(X, y):
    label_ = list(set(y))
    X_classify = {
     }
    for label in label_:
        X1 = np.array([X[i] for i in range(len(X)) if y[i] == label])
        X_classify[label] = X1

    miu = np.mean(X, axis=0)
    miu_classify = {
     }
    for label in label_:
        miu1 = np.mean(X_classify[label], axis=0)
        miu_classify[label] = miu1

    # St = np.dot((X - mju).T, X - mju)
    # 计算类内散度矩阵Sw
    Sw = np.zeros((len(miu), len(miu))) + 0.00001*np.random.rand(len(miu), len(miu))
    for i in label_:
        Sw += np.dot((X_classify[i] - miu_classify[i]).T,
                     X_classify[i] - miu_classify[i])

    #Sb = St-Sw
    # 计算类内散度矩阵Sb
    Sb = np.zeros((len(miu), len(miu)))
    for i in label_:
        Sb += len(X_classify[i]) * np.dot((miu_classify[i] - miu).reshape(
            (len(miu), 1)), (miu_classify[i] - miu).reshape((1, len(miu))))

    # 计算S_w^{-1}S_b的特征值和特征矩阵
    eig_vals, eig_vecs = np.linalg.eig(np.linalg.inv(Sw).dot(Sb))

    #对特征值进行由高到低的排序
    eig_vecs = np.array([eig_vecs[:,i] for i in np.argsort(-eig_vals)])

    return eig_vecs
LDA(resultTrain[6], y_train_arr).shape
(300, 300)
# 计算准确率
scores = []
for i in range(try_nums):
    score = []
    for k in range(1,201):
        X = LDA(resultTrain[i], y_train_arr)[:,:k]
        X_1 = resultTrain[i].dot(X)
        X_2 = resultTest[i].dot(X)
        accu = 0
        for m in range(len(y_test_arr)):
            a = [np.linalg.norm(X_2[m,:] - X_1[j,:]) for j in range(len(y_train_arr))]
            min_dix = np.argmin(a)
            if y_train_arr[min_dix] == y_test_arr[m]:
                accu += 1
        score.append(accu/len(y_test_arr))
    scores.append(score)
len(scores[0])
200
# 计算平均误分率
scoresMean = np.mean(scores, axis=0)
len(scoresMean)
errorMean = 1 - scoresMean
scoresMean
200

array([0.49166667, 0.57166667, 0.68333333, 0.70666667, 0.71      ,
       0.695     , 0.72333333, 0.71666667, 0.72166667, 0.75833333,
       0.76166667, 0.72      , 0.74666667, 0.765     , 0.755     ,
       0.78833333, 0.78833333, 0.78166667, 0.75333333, 0.775     ,
       0.79333333, 0.79833333, 0.78333333, 0.77      , 0.775     ,
       0.79      , 0.78666667, 0.81166667, 0.80833333, 0.79333333,
       0.805     , 0.79      , 0.77833333, 0.79166667, 0.8       ,
       0.82166667, 0.78333333, 0.79      , 0.79166667, 0.80166667,
       0.785     , 0.79666667, 0.795     , 0.80666667, 0.805     ,
       0.84333333, 0.82666667, 0.82333333, 0.79666667, 0.80166667,
       0.77333333, 0.81666667, 0.785     , 0.82333333, 0.82      ,
       0.84166667, 0.825     , 0.79166667, 0.795     , 0.795     ,
       0.82      , 0.81166667, 0.81833333, 0.79333333, 0.80833333,
       0.81666667, 0.78166667, 0.82166667, 0.80333333, 0.77333333,
       0.81      , 0.81833333, 0.79166667, 0.79      , 0.795     ,
       0.81666667, 0.83166667, 0.825     , 0.825     , 0.825     ,
       0.8       , 0.81333333, 0.83333333, 0.81666667, 0.815     ,
       0.77333333, 0.83      , 0.84333333, 0.80666667, 0.81666667,
       0.81833333, 0.80333333, 0.81      , 0.81166667, 0.81      ,
       0.805     , 0.835     , 0.84666667, 0.825     , 0.855     ,
       0.82166667, 0.80833333, 0.80666667, 0.80833333, 0.825     ,
       0.78666667, 0.815     , 0.80166667, 0.805     , 0.81333333,
       0.765     , 0.80166667, 0.78833333, 0.82166667, 0.77166667,
       0.815     , 0.82666667, 0.80666667, 0.82166667, 0.815     ,
       0.82833333, 0.80166667, 0.80666667, 0.805     , 0.80666667,
       0.805     , 0.82      , 0.80166667, 0.75666667, 0.805     ,
       0.81833333, 0.83666667, 0.80333333, 0.79833333, 0.8       ,
       0.79333333, 0.80166667, 0.82166667, 0.77333333, 0.805     ,
       0.785     , 0.79666667, 0.82      , 0.805     , 0.835     ,
       0.77166667, 0.825     , 0.78      , 0.82333333, 0.795     ,
       0.81      , 0.82      , 0.77833333, 0.805     , 0.82      ,
       0.795     , 0.805     , 0.755     , 0.79166667, 0.78333333,
       0.83833333, 0.81666667, 0.79666667, 0.80333333, 0.80666667,
       0.805     , 0.83      , 0.805     , 0.79833333, 0.80166667,
       0.81      , 0.80666667, 0.79333333, 0.81      , 0.75333333,
       0.82333333, 0.84      , 0.81833333, 0.8       , 0.79333333,
       0.81      , 0.81166667, 0.82      , 0.77833333, 0.81      ,
       0.82333333, 0.77833333, 0.80333333, 0.805     , 0.80166667,
       0.83333333, 0.80833333, 0.805     , 0.805     , 0.83333333,
       0.815     , 0.79666667, 0.82833333, 0.80833333, 0.85      ])
# 画平均误分率曲线
# N = 3
plt.figure(figsize=(12,6))
epochs = range(200)

bestScore = np.max(scoresMean)
bestError = np.min(errorMean)

plt.plot(epochs, scoresMean, label='Score: %0.3f' % bestScore)
plt.plot(epochs, errorMean, label='Error: %0.3f' % bestError)
plt.title('N = 3')
plt.legend()
Text(0.5, 1.0, 'N = 3')
# 画平均误分率曲线
# N = 5
plt.figure(figsize=(12,6))
epochs = range(200)

bestScore = np.max(scoresMean)
bestError = np.min(errorMean)

plt.plot(epochs, scoresMean, label='Score: %0.3f' % bestScore)
plt.plot(epochs, errorMean, label='Error: %0.3f' % bestError)
plt.title('N = 5')
plt.legend()
Text(0.5, 1.0, 'N = 5')
# 画平均误分率曲线
# N = 7
plt.figure(figsize=(12,6))
epochs = range(200)

bestScore = np.max(scoresMean)
bestError = np.min(errorMean)

plt.plot(epochs, scoresMean, label='Score: %0.3f' % bestScore)
plt.plot(epochs, errorMean, label='Error: %0.3f' % bestError)
plt.title('N = 7')
plt.legend()
Text(0.5, 1.0, 'N = 7')
2-2 Face detection
import cv2
import dlib
from imutils import face_utils
import matplotlib.pyplot as plt
%matplotlib inline
Haar Cascade in detail - https://towardsdatascience.com/a-guide-to-face-detection-in-python-3eab0f6b9fc1
More Haar Features in OpenCV - https://github.com/opencv/opencv/tree/master/data/haarcascades
# Haar Cascade Classifiers using OpenCV
def detectHC(imgpath):
    # 加载级联分类器文件
    cascPath = cv2.data.haarcascades+'haarcascade_frontalface_default.xml'
    faceCascade = cv2.CascadeClassifier(cascPath) # 定义级联分类器

    # 读取图片
    frame = cv2.imread(imgpath)
    # 转换通道模式
    frame = cv2.cvtColor(frame, cv2.COLOR_BGR2RGB)
    # 转为灰度图
    gray = cv2.cvtColor(frame, cv2.COLOR_BGR2GRAY)
    # 定义人脸检测器进行检测
    faces = faceCascade.detectMultiScale(
        gray,
        scaleFactor=1.1,
        minNeighbors=5,
        minSize=(200, 200),
        flags=cv2.CASCADE_SCALE_IMAGE
    )

    # 打印检测结果
    print(str(len(faces)) + ' faces can be detected!')

    # 在图片上画锚框
    for (x, y, w, h) in faces:
        cv2.rectangle(frame, (x, y), (x+w, y+h), (255, 0, 0), 3)

    plt.imshow(frame)
    plt.show()
detectHC('./project1-data-Detection/1.jpg')
1 faces can be detected!
detectHC('./project1-data-Detection/2.jpg')
0 faces can be detected!
detectHC('./project1-data-Detection/3.jpg')
0 faces can be detected!
One of the most popular implement for face detection is offered by Dlib and uses a concept called Histogram of Oriented Gradients (HOG). This is an implementation of the original paper by Dalal and Triggs - https://lear.inrialpes.fr/people/triggs/pubs/Dalal-cvpr05.pdf
# Histogram of Oriented Gradients (HOG) in Dlib
def detectDlib(imgpath):
    # 读取图片
    frame = cv2.imread(imgpath)
    # 通道模式转换
    frame = cv2.cvtColor(frame, cv2.COLOR_BGR2RGB)
    # 转为灰度图
    gray = cv2.cvtColor(frame, cv2.COLOR_BGR2GRAY)
    # 定义检测器
    face_detect = dlib.get_frontal_face_detector()
    # 进行人脸检测
    rects = face_detect(gray, 1)
    # 打印检测结果
    print(str(len(rects)) + ' faces can be detected!')

    for (i, rect) in enumerate(rects):

        (x, y, w, h) = face_utils.rect_to_bb(rect)
        # 将检测出的人脸可视化
        face = frame[y:y + w, x:x + h]
        plt.imshow(face)
        plt.show()
        # 在图片上画锚框
        cv2.rectangle(frame, (x, y), (x + w, y + h), (0, 255, 0), 3)
    plt.imshow(frame)
    plt.show()
detectDlib('./project1-data-Detection/1.jpg')
1 faces can be detected!
detectDlib('./project1-data-Detection/2.jpg')
3 faces can be detected!
rects = detectDlib('./project1-data-Detection/3.jpg')
7 faces can be detected!
完整代码地址
End…


