微信小程序+f2/wx-f2生成折线图
参考文档:wx-f2
其它实现方式:f2-canvas
2、wx-f2 是 F2 提供的微信小程序图表组件,故需要微信小程序支持使用 npm 安装第三方依赖包。所以有相关的版本要求:
小程序基础库版本 2.7.0 或以上

开发者工具 1.02.1808300 或以上,小程序开始支持使用 npm 安装第三方包
3、小程序的项目根目录中,默认情况下是没有package.json文件的,所以首先我们需要在小程序项目根目录下通过命令行创建package.json文件
npm init --yes
- 其实:npm init 就可以创建一个package.json文件,但是会弹出很多问题,可以输入对应的内容,也可以直接enter回车使用默认值,回答所有的问题,最后输入yes就会生成package.json文件
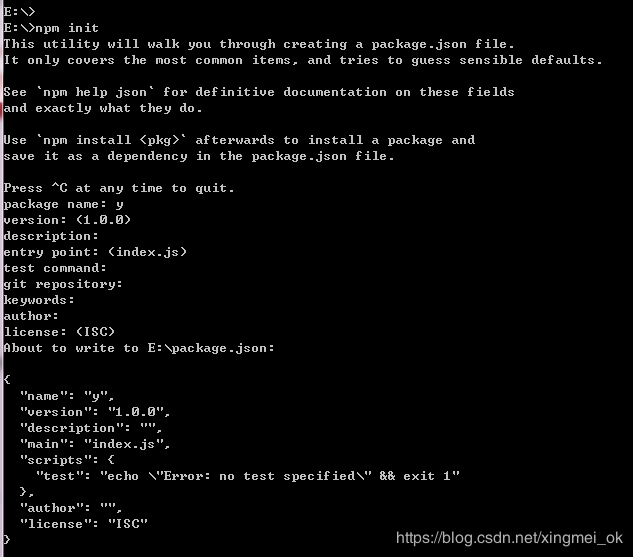
- 如果嫌弃回答很多问题麻烦,可以直接输入npm init --yes 跳过所有问题,直接生成使用默认值的package.json文件

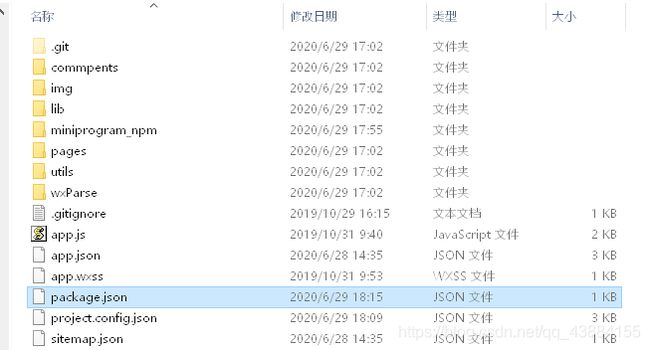
- 使用 npm init --yes 命令之后,会看到项目根目录中多出了package.json文件
4、使用命令行安装依赖包wx-f2
npm install @antv/wx-f2 --save
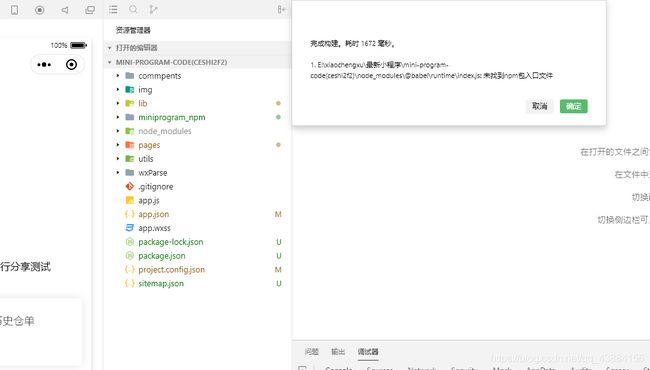
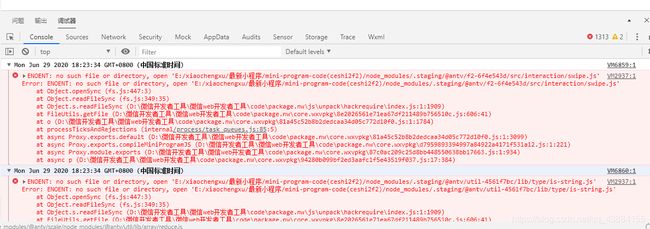
5、安装好依赖包之后,调试器会报错
6、点击 工具顶部菜单栏中的详情,勾选“使用 npm 模块”选项
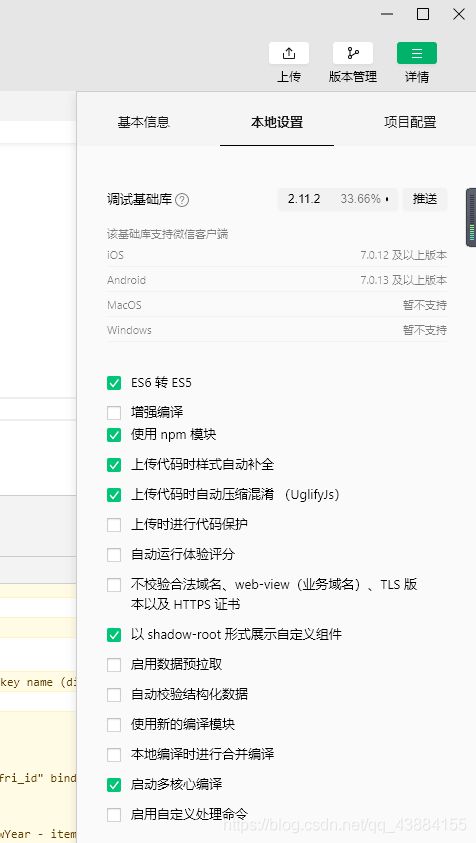
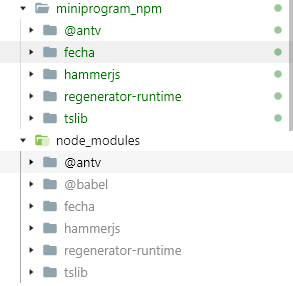
7、最后点击开发者工具中的菜单栏:工具 --> 构建 npm 即可运行

8、如果碰到 ‘@babel/runtime 未找到npm包入口文件’ 的报错,直接忽略就行了,不影响使用(强迫症碍眼的话,可以手动删除node_modules/@babel/runtime目录)
rm -rf node_modules/@babel/runtime
9、点击 完成构建 弹框中的确定按钮,到此为止,就可以开始使用自定义组件了
10、使用自定义组件
- json文件,引入组件
{

  "usingComponents": {

    "f2": "@antv/wx-f2"
  }
}
- wxml文件,使用组件
<view class="container">
  <f2 class="f2-chart" onInit="{
      {onInitChart}}" />
view>
- wxss文件,设置宽高
page {

  background-color: #fff;
}
.f2-chart {

  width: 100%;
  height: 500rpx;
}
- js文件,实例化图表
Page({

  data: {

    onInitChart(F2, config) {

      const chart = new F2.Chart(config);
      const data = [
        {
      value: 63.4, city: 'New York', date: '2011-10-01' },
        {
      value: 62.7, city: 'Alaska', date: '2011-10-01' },
        {
      value: 72.2, city: 'Austin', date: '2011-10-01' },
        {
      value: 58, city: 'New York', date: '2011-10-02' },
        {
      value: 59.9, city: 'Alaska', date: '2011-10-02' },
        {
      value: 67.7, city: 'Austin', date: '2011-10-02' },
        {
      value: 53.3, city: 'New York', date: '2011-10-03' },
        {
      value: 59.1, city: 'Alaska', date: '2011-10-03' },
        {
      value: 69.4, city: 'Austin', date: '2011-10-03' },
      ];
      chart.source(data, {

        date: {

          range: [0, 1],
          type: 'timeCat',
          mask: 'MM-DD'
        },
        value: {

          max: 300,
          tickCount: 4
        }
      });
      chart.area().position('date*value').color('city').adjust('stack');
      chart.line().position('date*value').color('city').adjust('stack');
      chart.render();
      // 注意:需要把chart return 出来
      return chart;
    }
  },
});
5、代码保存并编译之后,发现页面既不展示内容,也不报错。查阅GitHub上官方issues之后,终于找到了原因, 原来类名为 .container 的 view 必须要给个高度值,而官方 README.md 上并没有写 …
<view class="container" style="height: 300px;">
  <f2 class="f2-chart" onInit="{
      {onInitChart}}" />
view>
这时页面终于可以正常显示了

11、将js代码修改为我们之前在html5和vue中使用过的代码
- 修改代码
Page({

  data: {

    onInitChart(F2, config) {

      const data = [{

        date: '2017-06-05',
        value: 116
    },
    {

        date: '2017-06-06',
        value: 129
    },
    {

        date: '2017-06-07',
        value: 135
    },
    {

        date: '2017-06-08',
        value: 86
    },
    {

        date: '2017-06-09',
        value: 73
    },
    {

        date: '2017-06-10',
        value: 85
    },
    {

        date: '2017-06-11',
        value: 73
    },
    {

        date: '2017-06-12',
        value: 68
    },
    {

        date: '2017-06-13',
        value: 92
    },
    {

        date: '2017-06-14',
        value: 130
    },
    {

        date: '2017-06-15',
        value: 245
    },
    {

        date: '2017-06-16',
        value: 139
    },
    {

        date: '2017-06-17',
        value: 115
    },
    {

        date: '2017-06-18',
        value: 111
    },
    {

        date: '2017-06-19',
        value: 309
    },
    {

        date: '2017-06-20',
        value: 206
    },
    {

        date: '2017-06-21',
        value: 137
    },
    {

        date: '2017-06-22',
        value: 128
    },
    {

        date: '2017-06-23',
        value: 85
    },
    {

        date: '2017-06-24',
        value: 94
    }];

   	// Step 1: 创建 Chart 对象
   	const chart = new F2.Chart(config);

    // Step 2: 载入数据源
    chart.source(data, {

        value: {

            tickCount: 10,  // 坐标轴上刻度点的个数
            min: 50,    // 手动指定value字段最小值
            max: 350    // 手动指定value字段最大值
        },
        date: {

            type: 'timeCat',    // 指定date字段为时间类型
            range: [0, 0.8],    // 占x轴80%
            tickCount: 3   // 坐标轴上刻度点的个数
        }
    });

    // Step 3:使用图形语法进行图表的绘制
    // 注意:f2是移动端图表库,只有在移动端才能显示图例
    chart.tooltip({

        custom: true,   // 是否自定义 tooltip 提示框
        showXTip: true, // 是否展示 X 轴的辅助信息
        showYTip: true, // 是否展示 Y 轴的辅助信息
        snap: true, // 是否将辅助线准确定位至数据点
        crosshairsType: 'xy',   // 辅助线的种类
        crosshairsStyle: {
       // 配置辅助线的样式
            lineDash: [2],  // 点线的密度
            stroke: 'rgba(255, 0, 0, 0.25)',
            lineWidth: 2
        }
    });

    // 坐标轴配置(此处是为date对应的坐标轴进行配置)
    chart.axis('date', {

        label: function label(text, index, total) {

            const textCfg = {

                textAlign: 'center'
            };
            // 第一个点左对齐,最后一个点右对齐,其余居中,只有一个点时左对齐
            if (index === 0) {

                textCfg.textAlign = 'left';
            } else if (index === total - 1) {

                textCfg.textAlign = 'right';
            }
            textCfg.text = 'day: ' + text;  // textCfg.text 支持文本格式化处理
            return textCfg;
        }
    });
    // 点按照 x 轴连接成一条线,构成线图
    chart.line().position('date*value');

    // Step 4: 渲染图表
    chart.render();
      // 注意:需要把chart return 出来
      return chart;
    }
  },
});
- 保存并编译之后,发现页面又报错了…
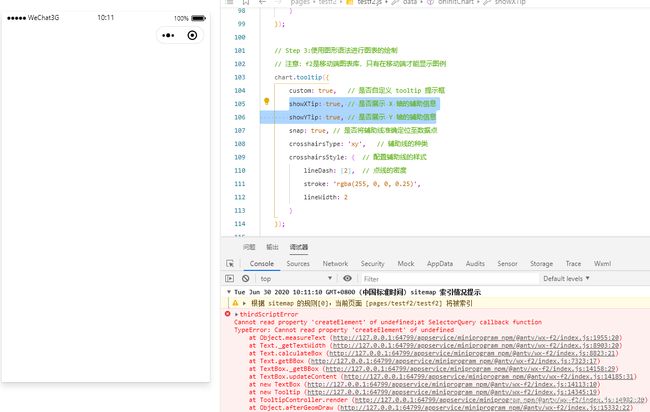

- 经过调试、查阅官方文档、官方issues等,发现是tooltip中 showXTip: true 和 showYTip: true 的问题,注释掉就不会报错
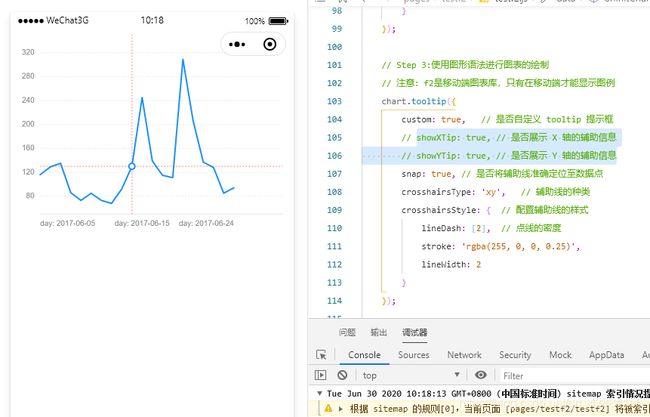
- 但是这样的效果并不是我们想要的,x轴和y轴的辅助信息都没有展示,查看报错信息,发现是 createElement 报错,找到 miniprogram_npm/@antv/wx-f2/index.js 文件目录,并定位到 createElement 位置


- 用到 createElement 的地方一共有两处,报错的原因是使用了 document ,而小程序并不是运行在窗口环境中,所以没有办法使用 document 或 window,故需要将这两处修改为小程序的语法
- 修改第一处

原代码 js
ctx = document.createElement('canvas').getContext('2d');
修改过后
wxml 添加id
<canvas
  type="2d"
  class="f2-canvas"
  bindtouchstart="touchStart"
  bindtouchmove="touchMove"
  bindtouchend="touchEnd"
  id="myChart"
>
canvas>
js
// ctx = document.createElement('canvas').getContext('2d');
ctx = wx.createCanvasContext('myChart', this);
原代码 js
var container = document.createElement('div');
修改过后 js
// var container = document.createElement('div');
const query = wx.createSelectorQuery().in(this);
var container = query.select('div');
12、上面的步骤是按照官方 README.md 的方法去构建了 wx-f2 组件,其实我们不用这么麻烦,如果已经有构建好的 wx-f2 组件,可以直接将其拷贝到我们自己的项目目录下,代码就可以正常运行了


