pyecharts可视化神器使用与避坑指南
文章目录
- 前言
- 一、pyecharts是什么?
- 二、使用步骤
-
- 1.如何安装
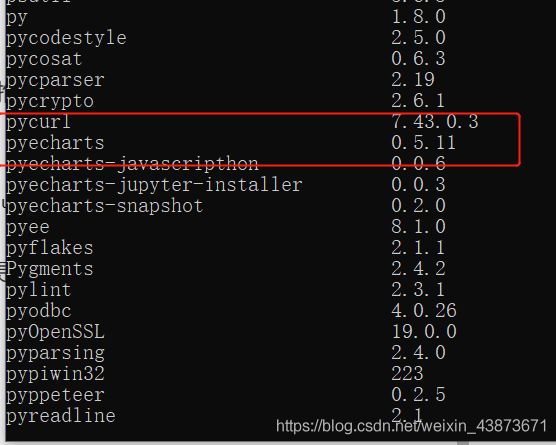
- 2.安装其他包
- 3.如何使用pyecharts画图
- (1)画柱状图
- (2)画折线图
- (3)画散点图
- (4)词云图展示
- (5)饼状图展示
- (6)地图数据展示
- (7)3d散点图
- 总结
前言
在PPT做汇报展示时总是会用到图表,但是一般在网上下载的图表,大部分是不符合我们实际数据的,而且清晰度也是达不到要求,于是我们就需要一个自己可以制作图表的工具来满足要求,于是pyecharts应运而生,最明显特点就是可以做出动态的数据图,更加高级展示数据。
提示:以下是本篇文章正文内容,下面案例可供参考
一、pyecharts是什么?
字面意思就是:PyEcharts = Python + Echarts。
ECharts是一个纯Javascript的图表库,可以流畅的运行在PC和移动设备上,兼容当前绝大部分浏览器,底层依赖轻量级的Canvas类库ZRender,提供直观、生动、可交互、可高度个性化定制的数据可视化图表。ECharts提供了常规的折线图、柱状图、散点图、饼图、K线图,用于统计的盒形图,用于地理数据可视化的地图、热力图、线图,用于关系数据可视化的关系图、treemap,多维数据可视化的平行坐标,还有用于BI的漏斗图、仪表盘,并且支持图与图之间的混搭。
二、使用步骤
1.如何安装
代码如下(示例):
pip install pyecharts
普通pip安装会导致安装极慢,推荐用下面清华镜像安装
pip install -i https://pypi.tuna.tsinghua.edu.cn/simple pyecharts
2.安装其他包
代码如下(示例):
这里有全球国家地图、中国省级、市级、县级地图和中国区域地图,每个也就几兆大小,可以都装上,在使用的时候方便导入。
pip install -i https://pypi.tuna.tsinghua.edu.cn/simple echarts-countries-pypkg

 pip install -i https://pypi.tuna.tsinghua.edu.cn/simple echarts-china-provinces-pypkg

 pip install -i https://pypi.tuna.tsinghua.edu.cn/simple echarts-china-cities-pypkg

 pip install -i https://pypi.tuna.tsinghua.edu.cn/simple echarts-china-counties-pypkg

 pip install -i https://pypi.tuna.tsinghua.edu.cn/simple echarts-china-misc-pypkg

 pip install -i https://pypi.tuna.tsinghua.edu.cn/simple echarts-united-kingdom-pypkg#如果提示缺少这个就安装一下

pip  install pyecharts_snapshot
该处使用的清华镜像安装地图包
3.如何使用pyecharts画图
(1)画柱状图
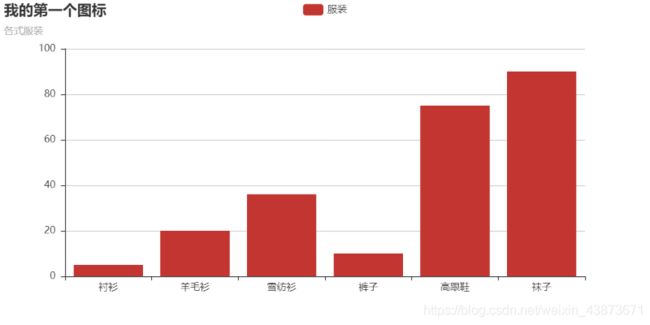
在生成的图中是动态的,当鼠标移到上面的时候会动态的显示数据。
from pyecharts import Bar
bar = Bar('我的第一个图标','各式服装')
bar.add('服装',['衬衫','羊毛衫','雪纺衫','裤子','高跟鞋','袜子'],[5,20,36,10,75,90])
(2)画折线图
from pyecharts import Line, Pie, Grid
from pyecharts_snapshot.main import make_a_snapshot

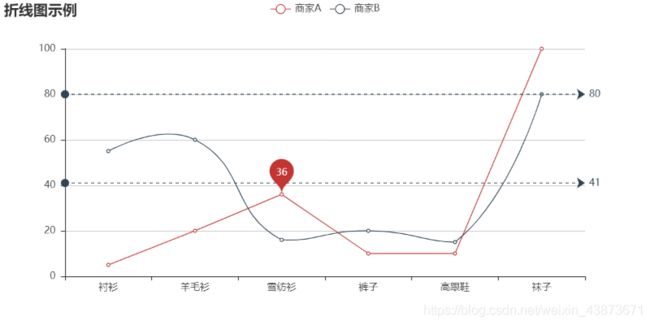
attr = ["衬衫", "羊毛衫", "雪纺衫", "裤子", "高跟鞋", "袜子"]
v1 = [5, 20, 36, 10, 10, 100]
v2 = [55, 60, 16, 20, 15, 80]
line = Line("折线图示例")
line.add("商家A", attr, v1, mark_point=["average"])
line.add("商家B", attr, v2, is_smooth=True, mark_line=["max", "average"])
#line.render('test.html')

#make_a_snapshot('test.html', 'test.pdf')
(3)画散点图
from pyecharts import EffectScatter

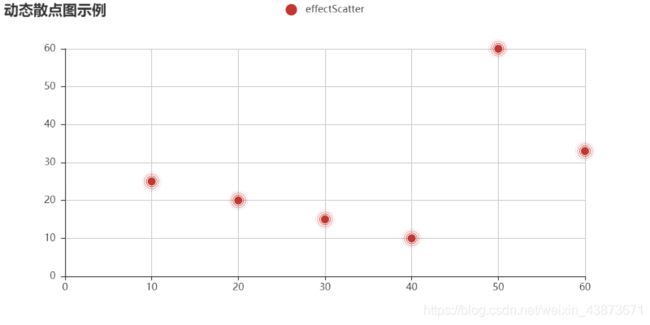
v1 = [10, 20, 30, 40, 50, 60]  # 横坐标
v2 = [25, 20, 15, 10, 60, 33]  #纵坐标
es = EffectScatter("动态散点图示例")
es.add("effectScatter", v1, v2)
#es.render()  # 默认在当前路径渲染成render.html文件
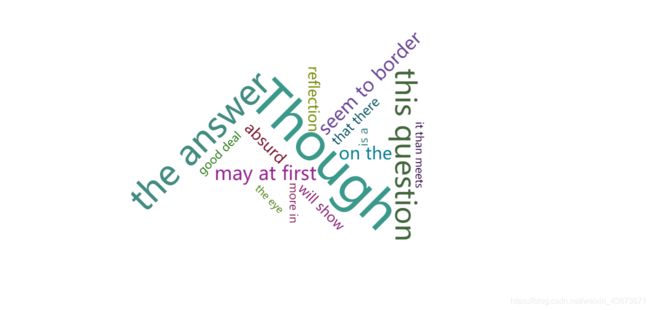
(4)词云图展示
from pyecharts import WordCloud
name = [
        'Though','the answer','this question',
        'may at first','seem to border','on the',
        'absurd','reflection','will show','that there',
        'is a','good deal','more in','it than meets','the eye'
        ]
value = [10000,6189,4556,2356,2233,
         1895,1456,1255,981,875,
         542,462,361,265,125]
worldcloud = WordCloud(width = 1300,height = 620)
worldcloud.add('',name,value,word_size_range = [20,100])
#worldcloud.render('./html/worldcloud01.html')
(5)饼状图展示
from pyecharts import Pie

attr = ["衬衫", "羊毛衫", "雪纺衫", "裤子", "高跟鞋", "袜子"]
v1 = [11, 12, 13, 10, 10, 10]
pie = Pie("饼图示例")
pie.add("", attr, v1, is_label_show=True)
#pie.show_config()
#pie.render()
(6)地图数据展示
from pyecharts import Map
value = [155,10,66,78]
attr = ['景县','安平县','阜城县','桃城区']
map = Map('河北衡水地图示例',width = 1200,height = 600)
map.add('',attr,value,maptype = '衡水',
        is_visualmap = True,
        visual_text_color = '#000',
        is_label_show = True
        )
#make_a_snapshot('test.html', 'test.pdf')
# #map.render('./html/map02.html')
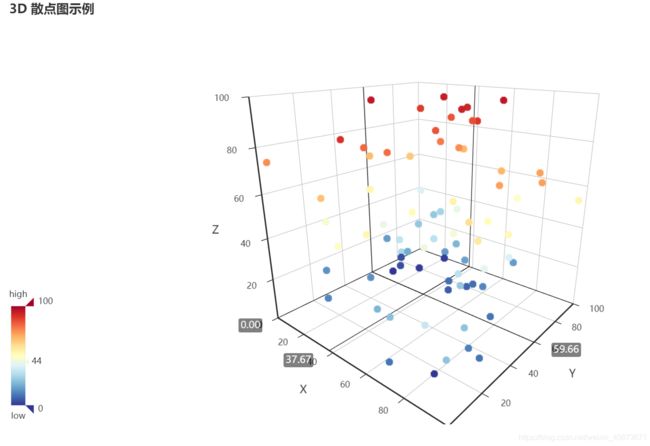
(7)3d散点图
# -*- coding:utf-8 -*-

from pyecharts import Scatter3D

import random

data = [[random.randint(0, 100), random.randint(0, 100), random.randint(0, 100)] for _ in range(80)]

range_color = ['#313695', '#4575b4', '#74add1', '#abd9e9', '#e0f3f8', '#ffffbf',

               '#fee090', '#fdae61', '#f46d43', '#d73027', '#a50026']

scatter3D = Scatter3D("3D 散点图示例", width=1200, height=600)

scatter3D.add("", data, is_visualmap=True, visual_range_color=range_color)

#scatter3D.render()
总结
pyecharts的功能是强大的,它可以使用python画出许多种类的数据图,为了方便人们的使用在生成图的右侧,还有保存为png的保存按钮,但是要注意的是保存的png图象是静态图,没有动态效果,因此,可以使用render()函数渲染为html文件,这样就有了动态效果,可以在浏览器打开,也可以添加到PPT文件中,使用PPT内置的浏览器进行打开,就能在报告中展示了。如果想在jupter notebook中展示图像效果。可以将render()函数注释掉,这样就可以了。
