吴恩达机器学习作业2---logistic regression
logistic regression
代码分析
测试1
首先导入将要用到的类库
import numpy as np
import matplotlib.pyplot as plt
import pandas as pd
from scipy import optimize
from scipy.special import expit #Vectorized sigmoid function

%matplotlib inline#可选
读入数据,并进行处理
datafile = 'data/ex2data1.txt'

#读入数据,逗号分开,转置
cols = np.loadtxt(datafile,delimiter=',',usecols=(0,1,2),unpack=True)

#X为前两列,y为最后一列,m为数据集大小
X = np.transpose(np.array(cols[:-1]))
y = np.transpose(np.array(cols[-1:]))
m = y.size

#在X矩阵前加上全为1的一列,作为theta_0
X = np.insert(X,0,1,axis=1)
将样本集分为两个部分
#将样本集分为两部分,一部分为1,一部分为0
pos = np.array([X[i] for i in range(X.shape[0]) if y[i] == 1])
neg = np.array([X[i] for i in range(X.shape[0]) if y[i] == 0])
数据集的可视化函数
#样本点的可视化函数
def plotData():
    plt.figure(figsize=(10,6))
    plt.plot(pos[:,1],pos[:,2],'k+',label='Admitted')
    plt.plot(neg[:,1],neg[:,2],'yo',label='Not admitted')
    plt.xlabel('Exam 1 score')
    plt.ylabel('Exam 2 score')
    plt.legend()#网格线
    plt.grid(True)
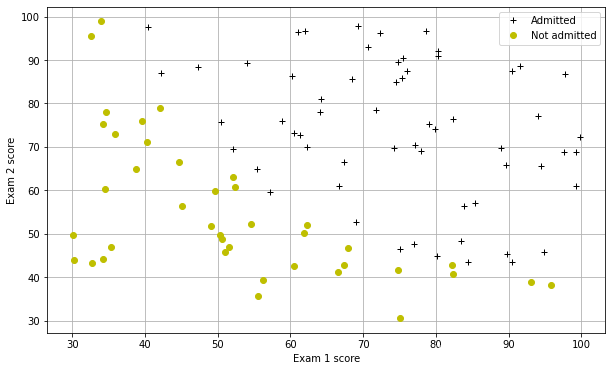
可视化
#可视化
plotData()
#检查一下expit函数

#expit(x) = 1/(1+exp(-x))
#myx为-10到10,以0.1为间隔的array
myx = np.arange(-10,10,.1)
plt.plot(myx,expit(myx))
plt.title("Woohoo this looks like a sigmoid function to me.")
plt.grid(True)

h θ ( x ) = g ( θ T x ) , g ( x ) = 1 1 + e − z h_{\theta}(x)=g(\theta^{T}x),g(x)=\frac{1}{1+e^{-z}} hθ(x)=g(θTx),g(x)=1+e−z1
#logistic regression的假设函数
def h(mytheta,myX): #Logistic hypothesis function
    return expit(np.dot(myX,mytheta))
J ( θ ) = − [ 1 m ∑ i = 1 m y ( i ) l o g h θ ( x ( i ) ) + ( 1 − y ( i ) ) l o g ( 1 − h θ ( x ( i ) ) ) + λ 2 m ∑ j = 1 n θ j 2 ] J(\theta)=-[\frac{1}{m}\sum_{i=1}^{m}y^{(i)}logh_{\theta}(x^{(i)})+(1-y^{(i)})log(1-h_{\theta}(x^{(i)}))+\frac{\lambda}{2m}\sum_{j=1}^{n}\theta_{j}^{2}] J(θ)=−[m1i=1∑my(i)loghθ(x(i))+(1−y(i))log(1−hθ(x(i)))+2mλj=1∑nθj2]
#损失函数,默认lambda为0,无正则化
def computeCost(mytheta,myX,myy,mylambda = 0.):
    term1 = np.dot(-np.array(myy).T,np.log(h(mytheta,myX)))
    term2 = np.dot((1-np.array(myy)).T,np.log(1-h(mytheta,myX)))
    #正则化参数,跳过theta0
    regterm = (mylambda/2) * np.sum(np.dot(mytheta[1:].T,mytheta[1:]))
    return float( (1./m) * ( np.sum(term1 - term2) + regterm ) )
测试
#测试
#Check that with theta as zeros, cost returns about 0.693:
initial_theta = np.zeros((X.shape[1],1))
computeCost(initial_theta,X,y)
输出:0.6931471805599452
最优化θ的函数,代替梯度下降
#优化θ的函数,代替梯度下降
def optimizeTheta(mytheta,myX,myy,mylambda=0.):
    result = optimize.fmin(computeCost, x0=mytheta, args=(myX, myy, mylambda), maxiter=400, full_output=True)
    return result[0], result[1]
调用优化函数,得到优化后的参数theta和最小cost值
theta, mincost = optimizeTheta(initial_theta,X,y)
Optimization terminated successfully.
Current function value: 0.203498
Iterations: 157
Function evaluations: 287
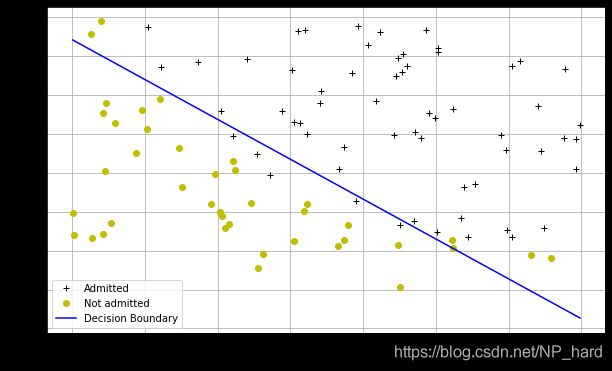
得到参数theta后画出决策界限
#测试1的成绩
boundary_xs = np.array([np.min(X[:,1]), np.max(X[:,1])])
#自变量为测试1成绩x的直线
boundary_ys = (-1./theta[2])*(theta[0] + theta[1]*boundary_xs)
#打印数据点
plotData()
plt.plot(boundary_xs,boundary_ys,'b-',label='Decision Boundary')
plt.legend()
#测试
给出一个ex1 45分,ex2 85分的学生,计算成功的概率
print (h(theta,np.array([1, 45.,85.])))
输出:0.7762915904112411
预测函数
#预测函数,概率大于0.5则返回True,否则返回False
def makePrediction(mytheta, myx):
    return h(mytheta,myx) >= 0.5
计算分类模型的准确率
#通过优化后的theta,测试样本集上预测的正确率

#成功预测为1的个数
pos_correct = float(np.sum(makePrediction(theta,pos)))
#成功预测为0的个数
neg_correct = float(np.sum(np.invert(makePrediction(theta,neg))))
tot = len(pos)+len(neg)
prcnt_correct = float(pos_correct+neg_correct)/tot
print("Fraction of training samples correctly predicted: %f." % prcnt_correct)
Fraction of training samples correctly predicted: 0.890000.
测试2
导入数据
datafile = 'data/ex2data2.txt'


cols = np.loadtxt(datafile,delimiter=',',usecols=(0,1,2),unpack=True) #Read in comma separated data

X = np.transpose(np.array(cols[:-1]))
y = np.transpose(np.array(cols[-1:]))
m = y.size # number of training examples

X = np.insert(X,0,1,axis=1)
分为两部分
pos = np.array([X[i] for i in range(X.shape[0]) if y[i] == 1])
neg = np.array([X[i] for i in range(X.shape[0]) if y[i] == 0])
可视化数据的函数
#可视化数据函数
def plotData():
    plt.plot(pos[:,1],pos[:,2],'k+',label='y=1')
    plt.plot(neg[:,1],neg[:,2],'yo',label='y=0')
    plt.xlabel('Microchip Test 1')
    plt.ylabel('Microchip Test 2')
    plt.legend()
    plt.grid(True)
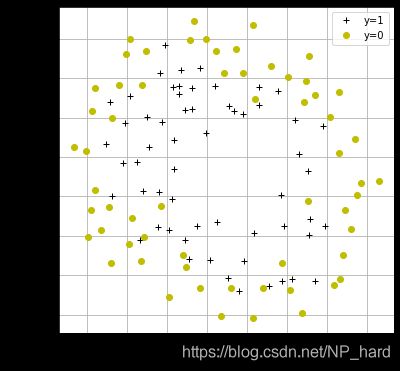
可视化
#可视化数据
plt.figure(figsize=(6,6))
plotData()
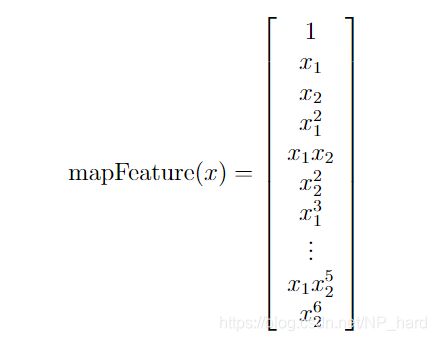
原本的输入X有两个自变量,为了更好的拟合决策边界,我们打算使用六阶的多项式来进行拟合
于是我们使用x1,x2这两个变量创造出了一个28维列向量作为输入
转换函数
def mapFeature( x1col, x2col ):
    degrees = 6
    #返回全为1的array
    out = np.ones( (x1col.shape[0], 1) )

    for i in range(1, degrees+1):#1-6
        for j in range(0, i+1):
            term1 = x1col ** (i-j)
            term2 = x2col ** (j)
            term  = (term1 * term2).reshape( term1.shape[0], 1 ) #(118,1)
            #把out和term水平叠加在一起(即把term水平加到out的右边)
            out = np.hstack(( out, term ))
    return out
测试
mappedX = mapFeature(X[:,1],X[:,2])
print(mappedX.shape)
输出:(118, 28)
初始化参数
#初始化参数
initial_theta = np.zeros((mappedX.shape[1],1))
采用minimize函数(BFGS算法),正则化方法对参数theta进行优化
#采用minimize函数(BFGS算法),正则化方法对参数theta进行优化
def optimizeRegularizedTheta(mytheta,myX,myy,mylambda=0.):
    result = optimize.minimize(computeCost, mytheta, args=(myX, myy, mylambda),  method='BFGS', options={
     "maxiter":500, "disp":False} )
    return np.array([result.x]), result.fun
计算得出优化后的参数theta和最小cost
#计算得出优化后的参数theta和最小cost
theta, mincost = optimizeRegularizedTheta(initial_theta,mappedX,y)
好了,得到参数θ后,我们画出决策界限
(采用等高线画法)
def plotBoundary(mytheta, myX, myy, mylambda=0.):
    theta, mincost = optimizeRegularizedTheta(mytheta,myX,myy,mylambda)
    xvals = np.linspace(-1,1.5,50)
    yvals = np.linspace(-1,1.5,50)
    zvals = np.zeros((len(xvals),len(yvals)))
    #zvals为决策界限
    for i in range(len(xvals)):
        for j in range(len(yvals)):
            myfeaturesij = mapFeature(np.array([xvals[i]]),np.array([yvals[j]]))
            zvals[i][j] = np.dot(theta,myfeaturesij.T)
    zvals = zvals.transpose()
    #转换为网格形数据
    u, v = np.meshgrid( xvals, yvals )
    #画等高线图
    mycontour = plt.contour( u, v, zvals, [0])
    #给等高线图加上标签
    myfmt = {
      0:'Lambda = %d'%mylambda}
    plt.clabel(mycontour, inline=1, fontsize=15, fmt=myfmt)
    plt.title("Decision Boundary")
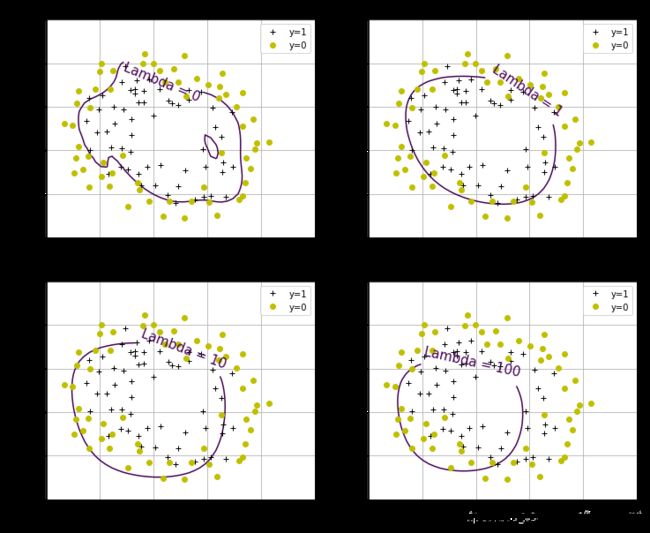
绘制
#Build a figure showing contours for various values of regularization parameter, lambda
#It shows for lambda=0 we are overfitting, and for lambda=100 we are underfitting

#依次画出不同正则化参数的决策边界的图像

plt.figure(figsize=(12,10))
#加一个小图
#221表示两行两列索引为1
plt.subplot(221)
plotData()
plotBoundary(theta,mappedX,y,0.)

plt.subplot(222)
plotData()
plotBoundary(theta,mappedX,y,1.)

plt.subplot(223)
plotData()
plotBoundary(theta,mappedX,y,10.)

plt.subplot(224)
plotData()
plotBoundary(theta,mappedX,y,100.)
测试集1
34.62365962451697,78.0246928153624,0
30.28671076822607,43.89499752400101,0
35.84740876993872,72.90219802708364,0
60.18259938620976,86.30855209546826,1
79.0327360507101,75.3443764369103,1
45.08327747668339,56.3163717815305,0
61.10666453684766,96.51142588489624,1
75.02474556738889,46.55401354116538,1
76.09878670226257,87.42056971926803,1
84.43281996120035,43.53339331072109,1
95.86155507093572,38.22527805795094,0
75.01365838958247,30.60326323428011,0
82.30705337399482,76.48196330235604,1
69.36458875970939,97.71869196188608,1
39.53833914367223,76.03681085115882,0
53.9710521485623,89.20735013750205,1
69.07014406283025,52.74046973016765,1
67.94685547711617,46.67857410673128,0
70.66150955499435,92.92713789364831,1
76.97878372747498,47.57596364975532,1
67.37202754570876,42.83843832029179,0
89.67677575072079,65.79936592745237,1
50.534788289883,48.85581152764205,0
34.21206097786789,44.20952859866288,0
77.9240914545704,68.9723599933059,1
62.27101367004632,69.95445795447587,1
80.1901807509566,44.82162893218353,1
93.114388797442,38.80067033713209,0
61.83020602312595,50.25610789244621,0
38.78580379679423,64.99568095539578,0
61.379289447425,72.80788731317097,1
85.40451939411645,57.05198397627122,1
52.10797973193984,63.12762376881715,0
52.04540476831827,69.43286012045222,1
40.23689373545111,71.16774802184875,0
54.63510555424817,52.21388588061123,0
33.91550010906887,98.86943574220611,0
64.17698887494485,80.90806058670817,1
74.78925295941542,41.57341522824434,0
34.1836400264419,75.2377203360134,0
83.90239366249155,56.30804621605327,1
51.54772026906181,46.85629026349976,0
94.44336776917852,65.56892160559052,1
82.36875375713919,40.61825515970618,0
51.04775177128865,45.82270145776001,0
62.22267576120188,52.06099194836679,0
77.19303492601364,70.45820000180959,1
97.77159928000232,86.7278223300282,1
62.07306379667647,96.76882412413983,1
91.56497449807442,88.69629254546599,1
79.94481794066932,74.16311935043758,1
99.2725269292572,60.99903099844988,1
90.54671411399852,43.39060180650027,1
34.52451385320009,60.39634245837173,0
50.2864961189907,49.80453881323059,0
49.58667721632031,59.80895099453265,0
97.64563396007767,68.86157272420604,1
32.57720016809309,95.59854761387875,0
74.24869136721598,69.82457122657193,1
71.79646205863379,78.45356224515052,1
75.3956114656803,85.75993667331619,1
35.28611281526193,47.02051394723416,0
56.25381749711624,39.26147251058019,0
30.05882244669796,49.59297386723685,0
44.66826172480893,66.45008614558913,0
66.56089447242954,41.09209807936973,0
40.45755098375164,97.53518548909936,1
49.07256321908844,51.88321182073966,0
80.27957401466998,92.11606081344084,1
66.74671856944039,60.99139402740988,1
32.72283304060323,43.30717306430063,0
64.0393204150601,78.03168802018232,1
72.34649422579923,96.22759296761404,1
60.45788573918959,73.09499809758037,1
58.84095621726802,75.85844831279042,1
99.82785779692128,72.36925193383885,1
47.26426910848174,88.47586499559782,1
50.45815980285988,75.80985952982456,1
60.45555629271532,42.50840943572217,0
82.22666157785568,42.71987853716458,0
88.9138964166533,69.80378889835472,1
94.83450672430196,45.69430680250754,1
67.31925746917527,66.58935317747915,1
57.23870631569862,59.51428198012956,1
80.36675600171273,90.96014789746954,1
68.46852178591112,85.59430710452014,1
42.0754545384731,78.84478600148043,0
75.47770200533905,90.42453899753964,1
78.63542434898018,96.64742716885644,1
52.34800398794107,60.76950525602592,0
94.09433112516793,77.15910509073893,1
90.44855097096364,87.50879176484702,1
55.48216114069585,35.57070347228866,0
74.49269241843041,84.84513684930135,1
89.84580670720979,45.35828361091658,1
83.48916274498238,48.38028579728175,1
42.2617008099817,87.10385094025457,1
99.31500880510394,68.77540947206617,1
55.34001756003703,64.9319380069486,1
74.77589300092767,89.52981289513276,1
测试集2
34.62365962451697,78.0246928153624,0
30.28671076822607,43.89499752400101,0
35.84740876993872,72.90219802708364,0
60.18259938620976,86.30855209546826,1
79.0327360507101,75.3443764369103,1
45.08327747668339,56.3163717815305,0
61.10666453684766,96.51142588489624,1
75.02474556738889,46.55401354116538,1
76.09878670226257,87.42056971926803,1
84.43281996120035,43.53339331072109,1
95.86155507093572,38.22527805795094,0
75.01365838958247,30.60326323428011,0
82.30705337399482,76.48196330235604,1
69.36458875970939,97.71869196188608,1
39.53833914367223,76.03681085115882,0
53.9710521485623,89.20735013750205,1
69.07014406283025,52.74046973016765,1
67.94685547711617,46.67857410673128,0
70.66150955499435,92.92713789364831,1
76.97878372747498,47.57596364975532,1
67.37202754570876,42.83843832029179,0
89.67677575072079,65.79936592745237,1
50.534788289883,48.85581152764205,0
34.21206097786789,44.20952859866288,0
77.9240914545704,68.9723599933059,1
62.27101367004632,69.95445795447587,1
80.1901807509566,44.82162893218353,1
93.114388797442,38.80067033713209,0
61.83020602312595,50.25610789244621,0
38.78580379679423,64.99568095539578,0
61.379289447425,72.80788731317097,1
85.40451939411645,57.05198397627122,1
52.10797973193984,63.12762376881715,0
52.04540476831827,69.43286012045222,1
40.23689373545111,71.16774802184875,0
54.63510555424817,52.21388588061123,0
33.91550010906887,98.86943574220611,0
64.17698887494485,80.90806058670817,1
74.78925295941542,41.57341522824434,0
34.1836400264419,75.2377203360134,0
83.90239366249155,56.30804621605327,1
51.54772026906181,46.85629026349976,0
94.44336776917852,65.56892160559052,1
82.36875375713919,40.61825515970618,0
51.04775177128865,45.82270145776001,0
62.22267576120188,52.06099194836679,0
77.19303492601364,70.45820000180959,1
97.77159928000232,86.7278223300282,1
62.07306379667647,96.76882412413983,1
91.56497449807442,88.69629254546599,1
79.94481794066932,74.16311935043758,1
99.2725269292572,60.99903099844988,1
90.54671411399852,43.39060180650027,1
34.52451385320009,60.39634245837173,0
50.2864961189907,49.80453881323059,0
49.58667721632031,59.80895099453265,0
97.64563396007767,68.86157272420604,1
32.57720016809309,95.59854761387875,0
74.24869136721598,69.82457122657193,1
71.79646205863379,78.45356224515052,1
75.3956114656803,85.75993667331619,1
35.28611281526193,47.02051394723416,0
56.25381749711624,39.26147251058019,0
30.05882244669796,49.59297386723685,0
44.66826172480893,66.45008614558913,0
66.56089447242954,41.09209807936973,0
40.45755098375164,97.53518548909936,1
49.07256321908844,51.88321182073966,0
80.27957401466998,92.11606081344084,1
66.74671856944039,60.99139402740988,1
32.72283304060323,43.30717306430063,0
64.0393204150601,78.03168802018232,1
72.34649422579923,96.22759296761404,1
60.45788573918959,73.09499809758037,1
58.84095621726802,75.85844831279042,1
99.82785779692128,72.36925193383885,1
47.26426910848174,88.47586499559782,1
50.45815980285988,75.80985952982456,1
60.45555629271532,42.50840943572217,0
82.22666157785568,42.71987853716458,0
88.9138964166533,69.80378889835472,1
94.83450672430196,45.69430680250754,1
67.31925746917527,66.58935317747915,1
57.23870631569862,59.51428198012956,1
80.36675600171273,90.96014789746954,1
68.46852178591112,85.59430710452014,1
42.0754545384731,78.84478600148043,0
75.47770200533905,90.42453899753964,1
78.63542434898018,96.64742716885644,1
52.34800398794107,60.76950525602592,0
94.09433112516793,77.15910509073893,1
90.44855097096364,87.50879176484702,1
55.48216114069585,35.57070347228866,0
74.49269241843041,84.84513684930135,1
89.84580670720979,45.35828361091658,1
83.48916274498238,48.38028579728175,1
42.2617008099817,87.10385094025457,1
99.31500880510394,68.77540947206617,1
55.34001756003703,64.9319380069486,1
74.77589300092767,89.52981289513276,1
