python-tensorflow-opencv《计算机视觉的深度学习实践》代码笔记
python-tensorflow-opencv《计算机视觉的深度学习实践》代码笔记
01 课程概述
tf_test:
import tensorflow as tf

# 创建2个矩阵,前者1行2列,后者2行1列,然后矩阵相乘:
matrix1 = tf.constant([[3,3]])
matrix2 = tf.constant([[2], [2]])
product = tf.matmul(matrix1,matrix2)

# 上边的操作是定义图,然后用会话Session去计算:
with tf.Session() as sess:
    result2 = sess.run(product)
    print(result2)

print("-----------------------------")

print(matrix1)
  [[12]]
   -----------------------------
   Tensor("Const_2:0", shape=(1, 2), dtype=int32)
opencv_test:
import cv2 as cv
#读取图像,支持 bmp、jpg、png、tiff 等常用格式
img = cv.imread("D:/vcprojects/images/lena.png")
#创建窗口并显示图像
cv.namedWindow("Image")
cv.imshow("Image",img)
cv.waitKey(0)
#释放窗口
cv.destroyAllWindows()
02 图像预处理
f1.py程序:
import cv2
import numpy as np
import matplotlib.pyplot as plt

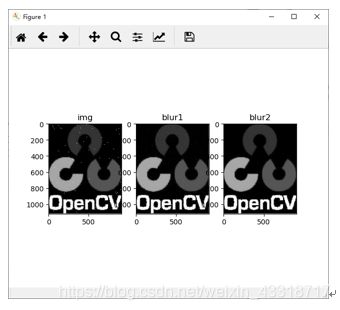
img = cv2.imread('D:/pictures/opencv.png',0) #直接读为灰度图像
for i in range(2000): #添加点噪声
    temp_x = np.random.randint(0,img.shape[0])
    temp_y = np.random.randint(0,img.shape[1])
    img[temp_x][temp_y] = 255

blur_1 = cv2.GaussianBlur(img,(5,5),0)

blur_2 = cv2.medianBlur(img,5)

plt.subplot(1,3,1),plt.imshow(img,'gray'),plt.title("img")#默认彩色,另一种彩色bgr
plt.subplot(1,3,2),plt.imshow(blur_1,'gray'),plt.title("blur1")
plt.subplot(1,3,3),plt.imshow(blur_2,'gray'),plt.title("blur2")
plt.show()
import numpy as np
import cv2 as cv
from matplotlib import pyplot as plt
img = cv.imread('D:/pictures/dave.png',0)

laplacian = cv.Laplacian(img,cv.CV_64F)
sobelx = cv.Sobel(img,cv.CV_64F,1,0,ksize=5)
sobely = cv.Sobel(img,cv.CV_64F,0,1,ksize=5)

plt.subplot(2,2,1),plt.imshow(img,cmap = 'gray')
plt.title('Original'), plt.xticks([]), plt.yticks([])

plt.subplot(2,2,2),plt.imshow(laplacian,cmap = 'gray')
plt.title('Laplacian'), plt.xticks([]), plt.yticks([])

plt.subplot(2,2,3),plt.imshow(sobelx,cmap = 'gray')
plt.title('Sobel X'), plt.xticks([]), plt.yticks([])

plt.subplot(2,2,4),plt.imshow(sobely,cmap = 'gray')
plt.title('Sobel Y'), plt.xticks([]), plt.yticks([])
plt.show()
import cv2 as cv
import numpy as np
from matplotlib import pyplot as plt

img = cv.imread('D:/pictures/opencv.png',0)

f = np.fft.fft2(img)
fshift = np.fft.fftshift(f)
magnitude_spectrum = 20*np.log(np.abs(fshift))

plt.subplot(121),plt.imshow(img, cmap = 'gray')
plt.title('Input Image'), plt.xticks([]), plt.yticks([])
plt.subplot(122),plt.imshow(magnitude_spectrum, cmap = 'gray')
plt.title('Magnitude Spectrum'), plt.xticks([]), plt.yticks([])
plt.show()
import cv2
import matplotlib.pyplot as plt

img = cv2.imread('D:/pictures/timg.jpg',0) #直接读为灰度图像
res = cv2.equalizeHist(img)#直接直方图均衡化

clahe = cv2.createCLAHE(clipLimit=2,tileGridSize=(10,10))
cl1 = clahe.apply(img)# 限制对比度自适应直方图均衡

plt.subplot(131),plt.imshow(img,'gray'),plt.title('img')
plt.subplot(132),plt.imshow(res,'gray'),plt.title('res')
plt.subplot(133),plt.imshow(cl1,'gray'),plt.title('cl1')

plt.show()
import numpy as np
import cv2 as cv

from matplotlib import pyplot as plt
img = cv.imread('D:/pictures/opencv.png')

kernel = np.ones((5,5),np.float32)/25
dst = cv.filter2D(img,-1,kernel)

plt.subplot(121),plt.imshow(img),plt.title('Original')
plt.xticks([]), plt.yticks([])
plt.subplot(122),plt.imshow(dst),plt.title('Averaging')
plt.xticks([]), plt.yticks([])
plt.show()

kernel
filter_1.ipynb结果:
array([[0.04, 0.04, 0.04, 0.04, 0.04],
[0.04, 0.04, 0.04, 0.04, 0.04],
[0.04, 0.04, 0.04, 0.04, 0.04],
[0.04, 0.04, 0.04, 0.04, 0.04],
[0.04, 0.04, 0.04, 0.04, 0.04]], dtype=float32)
03 图像特征与描述
imagestiching.py程序:
import numpy as np
import cv2

class Stitcher:

    #拼接函数
	def stitch(self, images, ratio=0.75, reprojThresh=4.0,showMatches=False):
		#获取输入图片
		(imageB, imageA) = images
		#检测A、B图片的SIFT关键特征点,并计算特征描述子
		(kpsA, featuresA) = self.detectAndDescribe(imageA)
		(kpsB, featuresB) = self.detectAndDescribe(imageB)

		# 匹配两张图片的所有特征点,返回匹配结果
		M = self.matchKeypoints(kpsA, kpsB, featuresA, featuresB, ratio, reprojThresh)

		# 如果返回结果为空,没有匹配成功的特征点,退出算法
		if M is None:
			return None

		# 否则,提取匹配结果
		# H是3x3视角变换矩阵
		(matches, H, status) = M
		# 将图片A进行视角变换,result是变换后图片
		result = cv2.warpPerspective(imageA, H, (imageA.shape[1] + imageB.shape[1], imageA.shape[0]))
		# 将图片B传入result图片最左端
		result[0:imageB.shape[0], 0:imageB.shape[1]] = imageB

		# 检测是否需要显示图片匹配
		if showMatches:
			# 生成匹配图片
			vis = self.drawMatches(imageA, imageB, kpsA, kpsB, matches, status)
			# 返回结果
			return (result, vis)

		# 返回匹配结果
		return result

	def detectAndDescribe(self, image):
		# 将彩色图片转换成灰度图
		gray = cv2.cvtColor(image, cv2.COLOR_BGR2GRAY)

		# 建立SIFT生成器
		descriptor = cv2.xfeatures2d.SIFT_create()
		# 检测SIFT特征点,并计算描述子
		(kps, features) = descriptor.detectAndCompute(image, None)

		# 将结果转换成NumPy数组
		kps = np.float32([kp.pt for kp in kps])

		# 返回特征点集,及对应的描述特征
		return (kps, features)

	def matchKeypoints(self, kpsA, kpsB, featuresA, featuresB, ratio, reprojThresh):
		# 建立暴力匹配器
		matcher = cv2.DescriptorMatcher_create("BruteForce")

		# 使用KNN检测来自A、B图的SIFT特征匹配对,K=2
		rawMatches = matcher.knnMatch(featuresA, featuresB, 2)

		matches = []
		for m in rawMatches:
			# 当最近距离跟次近距离的比值小于ratio值时,保留此匹配对
			if len(m) == 2 and m[0].distance < m[1].distance * ratio:
            # 存储两个点在featuresA, featuresB中的索引值
				matches.append((m[0].trainIdx, m[0].queryIdx))

		# 当筛选后的匹配对大于4时,计算视角变换矩阵
		if len(matches) > 4:
			# 获取匹配对的点坐标
			ptsA = np.float32([kpsA[i] for (_, i) in matches])
			ptsB = np.float32([kpsB[i] for (i, _) in matches])

			# 计算视角变换矩阵
			(H, status) = cv2.findHomography(ptsA, ptsB, cv2.RANSAC, reprojThresh)

			# 返回结果
			return (matches, H, status)

		# 如果匹配对小于4时,返回None
		return None

	def drawMatches(self, imageA, imageB, kpsA, kpsB, matches, status):
		# 初始化可视化图片,将A、B图左右连接到一起
		(hA, wA) = imageA.shape[:2]
		(hB, wB) = imageB.shape[:2]
		vis = np.zeros((max(hA, hB), wA + wB, 3), dtype="uint8")
		vis[0:hA, 0:wA] = imageA
		vis[0:hB, wA:] = imageB

		# 联合遍历,画出匹配对
		for ((trainIdx, queryIdx), s) in zip(matches, status):
			# 当点对匹配成功时,画到可视化图上
			if s == 1:
				# 画出匹配对
				ptA = (int(kpsA[queryIdx][0]), int(kpsA[queryIdx][1]))
				ptB = (int(kpsB[trainIdx][0]) + wA, int(kpsB[trainIdx][1]))
				cv2.line(vis, ptA, ptB, (0, 255, 0), 1)

		# 返回可视化结果
		return vis


# 读取拼接图片
imageA = cv2.imread("./left_01.png")
imageB = cv2.imread("./right_01.png")

# 把图片拼接成全景图
stitcher = Stitcher()
(result, vis) = stitcher.stitch([imageA, imageB], showMatches=True)

# 显示所有图片
cv2.imshow("Image A", imageA)
cv2.imshow("Image B", imageB)
cv2.imshow("Keypoint Matches", vis)
cv2.imshow("Result", result)
cv2.waitKey(0)
cv2.destroyAllWindows()
imagestiching.py结果:
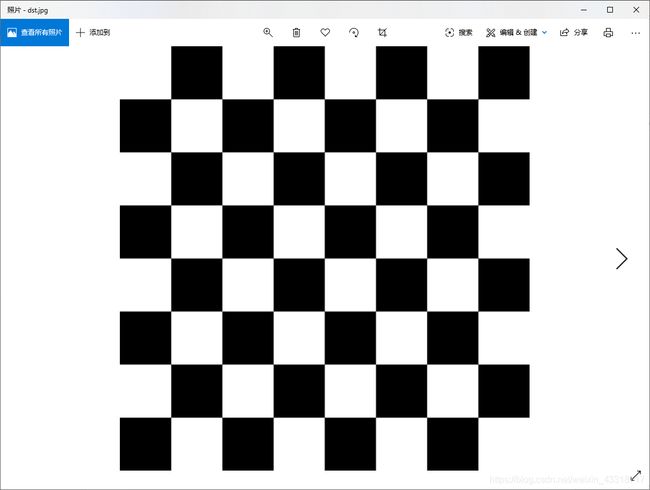
harris_corner.py程序:
import numpy as np
import cv2 as cv
filename = './chessboard.png'
img = cv.imread(filename)
gray = cv.cvtColor(img,cv.COLOR_BGR2GRAY)
gray = np.float32(gray)
dst = cv.cornerHarris(gray,2,3,0.04)
#result is dilated for marking the corners, not important
dst = cv.dilate(dst,None)
# Threshold for an optimal value, it may vary depending on the image.
img[dst>0.01*dst.max()]=[0,0,255]
#cv.imshow('dst',img)
cv.imwrite("D:/dst.jpg",img)

if cv.waitKey(0) & 0xff == 27:
    cv.destroyAllWindows()
harris_corner.py结果:
surf.py程序:
import numpy as np
import cv2 as cv
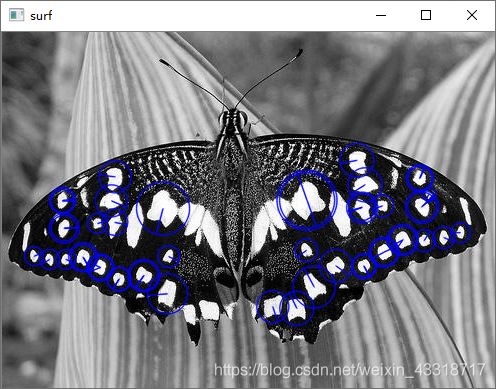
img = cv.imread('./butterfly.jpg',0)

surf = cv.xfeatures2d.SURF_create(400)

#kp, des = surf.detectAndCompute(img,None)
surf.setHessianThreshold(50000)

kp, des = surf.detectAndCompute(img,None)

img2 = cv.drawKeypoints(img,kp,None,(255,0,0),4)
cv.imshow('surf',img2)


cv.waitKey(0)
cv.destroyAllWindows()
import numpy as np
import cv2 as cv
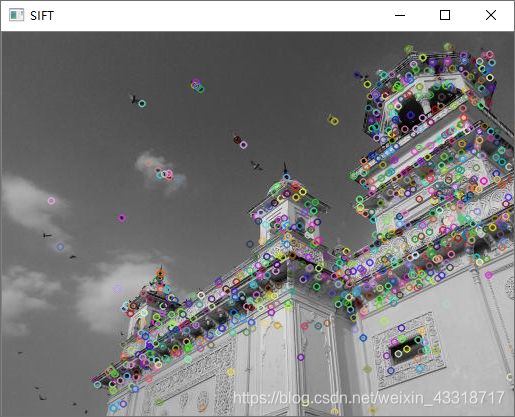
img = cv.imread('./home.jpg')
gray= cv.cvtColor(img,cv.COLOR_BGR2GRAY)
sift = cv.xfeatures2d.SIFT_create()
kp = sift.detect(gray,None)
img=cv.drawKeypoints(gray,kp,img)

cv.imshow("SIFT", img)
cv.imwrite('sift_keypoints.jpg',img)
cv.waitKey(0)
cv.destroyAllWindows()
import numpy as np
import cv2 as cv
import matplotlib.pyplot as plt
img1 = cv.imread('./box.png',0)          # queryImage
img2 = cv.imread('./box_in_scene.png',0) # trainImage
# Initiate ORB detector
orb = cv.ORB_create()
# find the keypoints and descriptors with ORB
kp1, des1 = orb.detectAndCompute(img1,None)
kp2, des2 = orb.detectAndCompute(img2,None)

# create BFMatcher object
bf = cv.BFMatcher(cv.NORM_HAMMING, crossCheck=True)
# Match descriptors.
matches = bf.match(des1,des2)
# Sort them in the order of their distance.
matches = sorted(matches, key = lambda x:x.distance)
# Draw first 10 matches.
img3 = cv.drawMatches(img1,kp1,img2,kp2,matches[:20],None, flags=2)
plt.imshow(img3),plt.show()
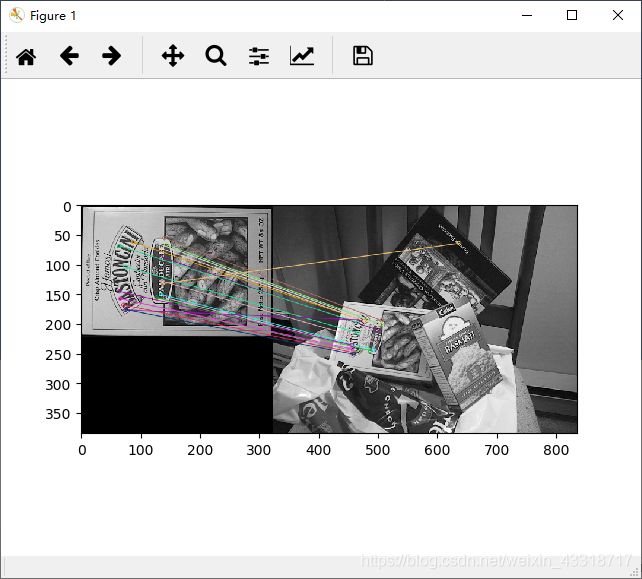
orb.py结果:
laplacian_sharpen.py程序:
from PIL import Image
import numpy as np

# 读入原图像
img = Image.open('./lena.png')
# img.show()

# 为了减少计算的维度,因此将图像转为灰度图
img_gray = img.convert('L')
img_gray.show()

# 得到转换后灰度图的像素矩阵
img_arr = np.array(img_gray)
h = img_arr.shape[0]  # 行
w = img_arr.shape[1]  # 列

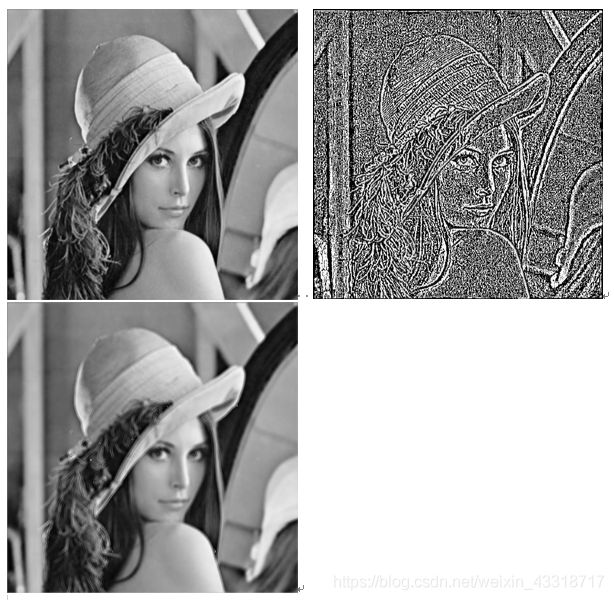
# 拉普拉斯算子锐化图像,用二阶微分
new_img_arr = np.zeros((h, w))  # 拉普拉斯锐化后的图像像素矩阵
for i in range(2, h-1):
    for j in range(2, w-1):
        new_img_arr[i][j] = img_arr[i+1, j] + img_arr[i-1, j] + \
                            img_arr[i, j+1] + img_arr[i, j-1] - \
                            4*img_arr[i, j]

# 拉普拉斯锐化后图像和原图像相加
laplace_img_arr = np.zeros((h, w))  # 拉普拉斯锐化图像和原图像相加所得的像素矩阵
for i in range(0, h):
    for j in range(0, w):
        laplace_img_arr[i][j] = new_img_arr[i][j] + img_arr[i][j]

img_laplace = Image.fromarray(np.uint8(new_img_arr))
img_laplace.show()

img_laplace2 = Image.fromarray(np.uint8(laplace_img_arr))
img_laplace2.show()

