sql语法树可视化插件
In this article we introduced a Flutter data visualization library based on Grammar of Graphics: Grapphic
在本文中,我们介绍了一个基于图形语法的Flutter数据可视化库: Grapphic
Repository
资料库
pub.dev
pub.dev
背景 (Background)
Data visualization is a common but important part of application development. A good visualization library always makes it easier to build data visualization charts. But unfortunately, there is not yet a perfect visualization library in Flutter community. The current candidates all have some unsatisfactoriness, such as:
数据可视化是应用程序开发中常见但重要的部分。 一个好的可视化库总是使构建数据可视化图表变得更加容易。 但是不幸的是,Flutter社区中还没有完善的可视化库。 目前的候选人都有些不满意,例如:
charts_flutter is developed by Google, and has very fine code quality. But it provides very limited chart categories. It lacks some commonly used features like smooth lines. Besides, it seems to be an experimental projects witch has no documents or manuals. Although it’s code is uploaded to GitHub, it is not open to any issue or PR. It has no new features updated for a long time.
Charts_flutter由Google开发,并且具有非常好的代码质量。 但是它提供的图表类别非常有限。 它缺少一些常用的功能,例如线条流畅。 此外,这似乎是一个实验性项目,没有文件或手册。 尽管其代码已上传到GitHub,但尚无任何问题或PR。 它没有长时间更新的新功能。
fl_chart is the most popular visualization library on pub.dev. It has cool designs and animations. It is developed by an Iran handsome . But it has too much personal style for some statistics or serious situations.
fl_chart是pub.dev上最受欢迎的可视化库。 它具有很酷的设计和动画。 它是由一位伊朗帅哥开发的。 但是对于某些统计数据或严重情况,它的个人风格太多。
syncfusion_flutter_charts is very complete and professional. But it’s a commercial product and not open sourced. It needs paid licenses. That’s not suitable for many developers.
syncfusion_flutter_charts非常完整和专业。 但这是一种商业产品,不是开源的。 它需要付费许可证。 这不适用于许多开发人员。
To build complex visualization charts, we developed flutter_echarts , Witch imports Echarts (A powerful Web visualization library) into Flutter Apps by Webview. It did help to satisfy some complex demands, but Webview has some weaknesses in performance and compatibility. For fluency and stability, we still need a native Flutter data visualization library.
为了构建复杂的可视化图表,我们开发了flutter_echarts ,Witch通过Webview将Echarts(强大的Web可视化库)导入Flutter Apps。 它确实有助于满足一些复杂的需求,但是Webview在性能和兼容性方面存在一些弱点。 为了保持流畅和稳定,我们仍然需要原生的Flutter数据可视化库。
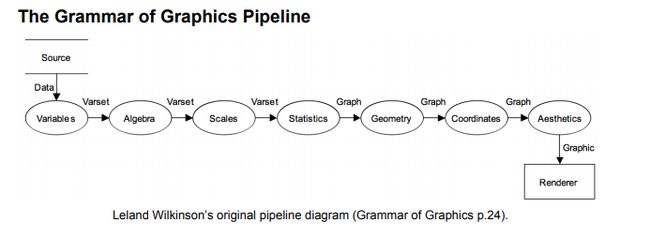
In recent years, data visualization in frontend development has progressed a lot. Grammar of Graphics theory has been applied to web visualization libraries. this theory is proposed by Leland Wilkinson in the book The Grammar of Graphics. It tries to describe grammar rules for all statistic graphics.
近年来,前端开发中的数据可视化取得了很大进展。 图形理论的语法已应用于Web可视化库。 这个理论是由Leland Wilkinson在“图形语法”一书中提出的。 它试图描述所有统计图形的语法规则。

Thanks to this theory, the visualization library will no longer be limited to the traditional charts categories like line/bar/pie. Data visualization is abstracted to combination of geometry marks, coordinates, and scales, witch highly increased flexibility and extensibility. Frontend visualization libraries based on Grammar of Graphics are vega , AntV of Alipay, and chart-part of Microsoft.
由于有了这一理论,可视化库将不再局限于传统的图表类别,如线/条/饼图。 数据可视化被抽象为几何标记,坐标和比例的组合,从而极大地提高了灵活性和可扩展性。 基于图形语法的前端可视化库是vega ,支付宝的AntV和Microsoft的图表部分。
So, there comes Grapphic : a Flutter data visualization library based on Grammar of Graphics.
因此,出现了Grapphic :一个基于Graphics Grammar的Flutter数据可视化库。
例 (Example)
A basic example of Graphic:
图形的基本示例:
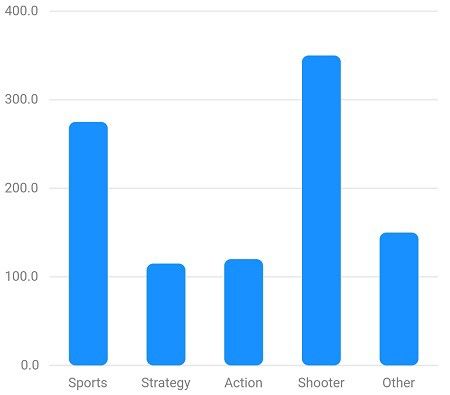
graphic.Chart(
  data: [
    { 'genre': 'Sports', 'sold': 275 },
    { 'genre': 'Strategy', 'sold': 115 },
    { 'genre': 'Action', 'sold': 120 },
    { 'genre': 'Shooter', 'sold': 350 },
    { 'genre': 'Other', 'sold': 150 },
  ],
  scales: {

    'genre': graphic.CatScale(
      accessor: (map) => map['genre'] as String,
    ),
    'sold': graphic.NumScale(
      accessor: (map) => map['sold'] as num,
      nice: true,
    )
  },
  geoms: [graphic.IntervalGeom(
    position: graphic.PositionAttr(field: 'genre*sold'),
    shape: graphic.ShapeAttr(values: [
      graphic.Shapes.rrectInterval(radius: Radius.circular(5))
    ]),
  )],
  axes: {

    'genre': graphic.Defaults.horizontalAxis,
    'sold': graphic.Defaults.verticalAxis,
  },
)
More examples please see in Example App
更多示例请参见示例应用
特征(Features)
Grammar of Graphics
图形语法
Data visualization can be roughly summarized to: Mapping data to visual channel attribute(color, shape, size, position…) values by a certain rule, and then render shapes with these attributes. In Grammar of Graphics, this progress can be concrete to:
数据可视化可以大致概括为:根据特定规则将数据映射到可视通道属性(颜色,形状,大小,位置等)值,然后使用这些属性渲染形状。 在“图形语法”中,此进度可以具体实现:
In Graphic, the design of APIs and class names are mainly refered to AntV. The core concepts are:
在Graphic中,API和类名的设计主要参考AntV。 核心概念是:
Geom: Geometry marks, or shapes to compose the chart.
Geom :组成图表的几何标记或形状。
Coord: Coordinates of the chart, including two types: Cartesian and Polar.
坐标:图表的坐标,包括两种类型:笛卡尔坐标和极坐标。
Scale: Rules to scale data into [0, 1], for the usage to map to visual channel attributes.
比例尺:将数据比例尺缩放为[0,1]的规则,用于映射到可视通道属性。
Attr: Visual channel attributes, including color, shape, size, position… The value is decided by scaled data. they are applied to geometry marks.
属性:可视通道属性,包括颜色,形状,大小,位置……值由缩放数据决定。 它们应用于几何标记。
These concepts are familiar for those who has already known about Grammar of Graphics. If you have never met them, please refer to the book. We think that Grammar of Graphics is an important part of data visualization, so weather you will use related libraries or not , it worth learning.
这些概念对于已经了解图形语法的人很熟悉。 如果您从未见过他们,请参阅这本书。 我们认为图形语法是数据可视化的重要组成部分,因此无论您是否使用相关库,都值得学习。
Declarative Chart
声明图
Most visualization libraries in Web is imperative, and plot charts by calling a series of functions. AntV is not an exception. But in Flutter, declarative and reactive views are advocated. The constructor of view is configured by the tree returned in build function. It’s worth mentioning that this is also a important deference between Web Canvas and Flutter CustomPaint Widget.
Web中的大多数可视化库都是必须的,并且可以通过调用一系列函数来绘制图表。 AntV也不例外。 但是在Flutter中,提倡声明式和被动式的观点。 视图的构造函数由build函数中返回的树配置。 值得一提的是,这也是Web Canvas和Flutter CustomPaint Widget之间的重要区别。
So Graphic APIs is designed declarative. All information are configured by props of graphic.Chart Widget. The chart will rerender when the widget tree updates. By the way, we will optimize the rerender performance in the future.
因此,图形API设计为声明性的。 所有信息均由graphic.Chart Widget的属性配置。 小部件树更新时,图表将重新呈现。 顺便说一下,我们将来会优化重渲染性能。
Custom Shape
自定义形状
Why there can be all kinds of various charts? the key is the diversity of shape attribute. so it is the most complex one in all visual channel attributes. The customizability of shape attribute determines the extensibility of visualization libraries.
为什么会有各种各样的图表? 关键是形状属性的多样性。 因此它是所有视觉渠道属性中最复杂的一项。 形状属性的可定制性决定了可视化库的可扩展性。
In Graphic, the shape attribute is defined to functions or high order functions. It receives values of visual channel attributes of geometry marks, and returns the composed render shapes for the render engine. Users can custom their own shape functions:
在“图形”中,shape属性定义为函数或高阶函数。 它接收几何标记的可视通道属性值,并为渲染引擎返回合成的渲染形状。 用户可以自定义自己的形状功能:
List triangleInterval(
  List attrValueRecords,
  graphic.CoordComponent coord,
  Offset origin,
) {

  // Implementation of attrValueRecords => renderShapes
}
去做 (TODO)
Graphic has now mainly finished static charts. We will add features such as interactions, animations, and components like tooltip, legend in the future.
图形现在主要完成静态图表。 将来,我们将添加交互,动画等功能,以及工具提示,图例等组件。
The features and APIs may be unstable for now. So you are welcome for trial, but be cautious to use it in production environment.
这些功能和API可能暂时不稳定。 因此,欢迎您试用,但在生产环境中请谨慎使用。
翻译自: https://medium.com/@entronad/graphic-a-flutter-data-visualization-library-base-on-grammar-of-graphics-75ca751f5cae
sql语法树可视化插件