当python遇上echarts (二)绘制基本图表
当python遇上echarts(一)了解基本知识
实战促练
通过一个小项目,绘制折线图,饼图,柱状图,圆弧饼图,词云图等
一、示例
import requests
from bs4 import BeautifulSoup
import json,re
from pyecharts import options as opts
from pyecharts.charts import Bar,Line


url_search = 'https://c.y.qq.com/soso/fcgi-bin/client_search_cp?'
headers = {

    'user-agent':'Mozilla/5.0 (Windows NT 10.0; Win64; x64) AppleWebKit/537.36 (KHTML, like Gecko) Chrome/88.0.4324.150 Safari/537.36',
    'referer':'https://y.qq.com/',
    'origin':'https://y.qq.com'
}

params_str = '''
    ct: 24
    qqmusic_ver: 1298
    new_json: 1
    remoteplace: txt.yqq.song
    searchid: 65264922900538759
    t: 0
    aggr: 1
    cr: 1
    catZhida: 1
    lossless: 0
    flag_qc: 0
    p: 1
    n: 10
    w: 林俊杰
    g_tk_new_20200303: 5381
    g_tk: 5381
    loginUin: 0
    hostUin: 0
    format: json
    inCharset: utf8
    outCharset: utf-8
    notice: 0
    platform: yqq.json
    needNewCode: 0
'''

def switch_to_dict(params_str):
    params = {
     }
    p = params_str.replace('\n',',').replace(' ','')
    p_l = p.split(',')
    for i in p_l:
        if i:
            i = i.split(':')
            params[i[0]] = i[1]
    return params
params = switch_to_dict(params_str)

singer_list = ['周杰伦','林俊杰','王力宏','张杰','汪苏泷','许嵩','薛之谦','陈奕迅','李荣浩','陶喆']
song_list =[]
album_list = []
mv_list = []

def crawl():
    for singer in singer_list:
        params['w'] = singer
        #搜索页面的response
        res_serach = requests.get(url_search,headers = headers,params = params)
        #将json数据转化为dict数据
        json_search = res_serach.json()
        #单曲数量
        song_num = json_search['data']['zhida']['zhida_singer']['songNum']
        album_num = json_search['data']['zhida']['zhida_singer']['albumNum']
        mv_num = json_search['data']['zhida']['zhida_singer']['mvNum']
        song_list.append(song_num)
        album_list.append(album_num)
        mv_list.append(mv_num)
    return song_list,album_list,mv_list
song_list,album_list,mv_list = crawl()
print(song_list,album_list,mv_list)


def set_bar():
    bar = Bar(init_opts=opts.InitOpts(width = '800px',height = '800px',page_title='qq音乐柱状图'))
    bar.add_xaxis(xaxis_data = singer_list)
    bar.add_yaxis(series_name = '单曲',y_axis = song_list)
    bar.add_yaxis(series_name = 'MV',y_axis = mv_list)
    bar.set_global_opts(
        title_opts=opts.TitleOpts(title = '我喜欢的九位歌手',subtitle='数错了,是十位',pos_left='20%'),
        #添加坐标轴名称,位置以及大小
        xaxis_opts = opts.AxisOpts(name = '歌手',name_location='center',name_gap=25,name_textstyle_opts=opts.TextStyleOpts(font_size = 20)),
        yaxis_opts = opts.AxisOpts(name = '单曲数量/首')
        )
    #增加一个y轴
    bar.extend_axis(
        yaxis = opts.AxisOpts(
            name = '专辑数量/个',
            type_ = 'value',
            min_ = -20,
            max_ = 110,
            interval=5
        )
    )
    return bar

def set_line():
    line = Line()
    line.add_xaxis(xaxis_data = singer_list)
    line.add_yaxis(
        series_name = '专辑',
        y_axis = album_list,
        yaxis_index = 1
        )
    line.set_global_opts(legend_opts=opts.LegendOpts(legend_icon='pin'))
    return line

bar = set_bar()
line = set_line()
bar.overlap(line).render('十位歌手.html')

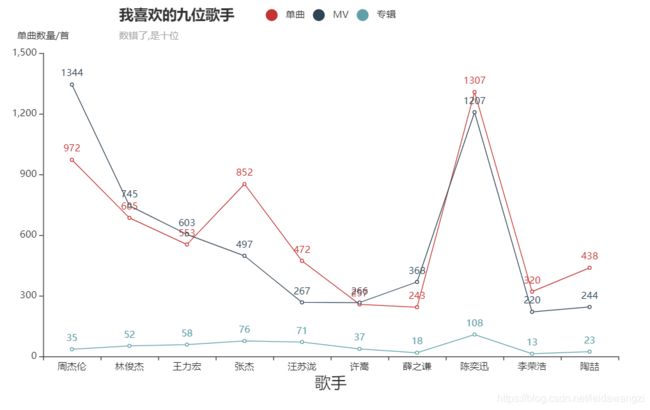
当然,刚开始绘图,折线图和柱状图的混合有点难度,下面通过这些数据,把基本图表都过一遍
song_list = [972, 685, 553, 852, 472, 257, 243, 1307, 320, 438]
album_list = [35, 52, 58, 76, 71, 37, 18, 108, 13, 23]
mv_list = [1344, 745, 603, 497, 267, 266, 368, 1207, 220, 244]
singer_list = ['周杰伦','林俊杰','王力宏','张杰','汪苏泷','许嵩','薛之谦','陈奕迅','李荣浩','陶喆']
二、柱状图
from pyecharts import options as opts
from pyecharts.charts import Bar
#柱状图的数据格式:x轴和y轴都是列表数据
song_list = [972, 685, 553, 852, 472, 257, 243, 1307, 320, 438]
album_list = [35, 52, 58, 76, 71, 37, 18, 108, 13, 23]
mv_list = [1344, 745, 603, 497, 267, 266, 368, 1207, 220, 244]
singer_list = ['周杰伦','林俊杰','王力宏','张杰','汪苏泷','许嵩','薛之谦','陈奕迅','李荣浩','陶喆']

def set_bar():
    #设置初始项,图表高width,宽height,以及网页的名称
    bar = Bar(init_opts=opts.InitOpts(width = '800px',height = '600px',page_title='qq音乐柱状图'))
    #添加x轴数据
    bar.add_xaxis(xaxis_data = singer_list)
    #添加y轴数据,加上series_name,表示图例
    bar.add_yaxis(series_name = '单曲',y_axis = song_list)
    bar.add_yaxis(series_name = 'MV',y_axis = mv_list)
    bar.add_yaxis(series_name = '专辑',y_axis = album_list)
    #设置全局项
    bar.set_global_opts(
        #设置图表主标题,副标题和标题位置
        title_opts=opts.TitleOpts(title = '我喜欢的九位歌手',subtitle='数错了,是十位',pos_left='20%'),
        #添加坐标轴名称,位置以及大小,name_gap表示名称与x轴距离,font_size是字体大小
        xaxis_opts = opts.AxisOpts(name = '歌手',name_location='center',name_gap=25,name_textstyle_opts=opts.TextStyleOpts(font_size = 20)),
        yaxis_opts = opts.AxisOpts(name = '单曲数量/首')
        )
    return bar

bar = set_bar()
#生成html文件
bar.render('柱状图.html')
三、折线图
from pyecharts import options as opts
from pyecharts.charts import Line

#折线图的数据格式:x轴和y轴都是列表数据
song_list = [972, 685, 553, 852, 472, 257, 243, 1307, 320, 438]
album_list = [35, 52, 58, 76, 71, 37, 18, 108, 13, 23]
mv_list = [1344, 745, 603, 497, 267, 266, 368, 1207, 220, 244]
singer_list = ['周杰伦','林俊杰','王力宏','张杰','汪苏泷','许嵩','薛之谦','陈奕迅','李荣浩','陶喆']

def set_line():
    line = Line()
    line.add_xaxis(xaxis_data = singer_list)
    #添加y轴数据,加上series_name,表示图例
    line.add_yaxis(series_name = '单曲',y_axis = song_list)
    line.add_yaxis(series_name = 'MV',y_axis = mv_list)
    line.add_yaxis(series_name = '专辑',y_axis = album_list)
    line.set_global_opts(
        #设置图例形状
        legend_opts=opts.LegendOpts(legend_icon='pin'),
        #设置图表主标题,副标题和标题位置
        title_opts=opts.TitleOpts(title = '我喜欢的九位歌手',subtitle='数错了,是十位',pos_left='20%'),
        #添加坐标轴名称,位置以及大小,name_gap表示名称与x轴距离,font_size是字体大小
        xaxis_opts = opts.AxisOpts(name = '歌手',name_location='center',name_gap=25,name_textstyle_opts=opts.TextStyleOpts(font_size = 20)),
        yaxis_opts = opts.AxisOpts(name = '单曲数量/首')
        )
    return line

line = set_line()
line.render('折线图.html')
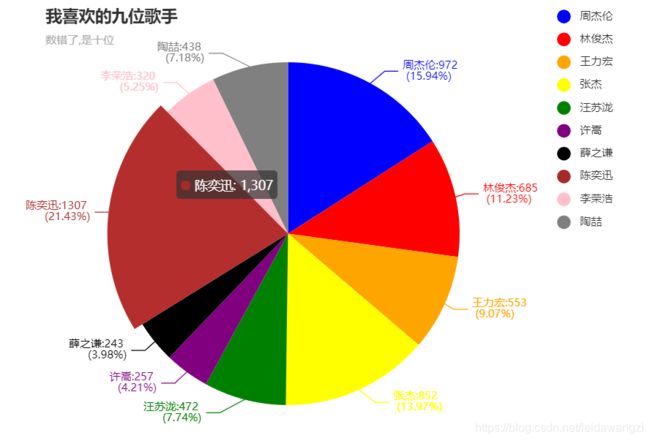
四、饼图 Pie
from pyecharts import options as opts
#导入Pie类
from pyecharts.charts import Pie

#饼图的数据类型,为列表的嵌套:[[key1, value1], [key2, value2]]
song_list = [972, 685, 553, 852, 472, 257, 243, 1307, 320, 438]
singer_list = ['周杰伦','林俊杰','王力宏','张杰','汪苏泷','许嵩','薛之谦','陈奕迅','李荣浩','陶喆']
#使用zip函数后[(972, '周杰伦'), (685, '林俊杰'), (553, '王力宏'), (852, '张杰'), (472, '汪苏泷'), (257, '许嵩'), (243, '薛之谦'), (1307, '陈奕迅'), (320, '李荣浩'), (438, '陶喆')]
#再将其中的元组转换成列表
data_pair =  [list(i) for i in zip(singer_list,song_list)]

def set_pie():
    pie = Pie()
    pie.add(
        series_name = '',
        data_pair = data_pair,
        color = 'red',
        #设置图表的标签(指示图表区域),formatter是设置标签内容格式,在饼图中:{a}(系列名称),{b}(数据项名称),{c}(数值), {d}(百分比)
        label_opts = opts.LabelOpts(is_show=True,formatter='{b}:{c} \n ({d}%)'),
        # 是否展示成南丁格尔图,通过半径区分数据大小,有'radius'和'area'两种模式。
        # radius:扇区圆心角展现数据的百分比,半径展现数据的大小
        # area:所有扇区圆心角相同,仅通过半径展现数据大小
        rosetype = 'radius',
        # 饼图的半径,数组的第一项是内半径,第二项是外半径
        # 默认设置成百分比,相对于容器高宽中较小的一项的一半
        radius=['20%','75%']
    )
    pie.set_global_opts(
        #设置图例形状,位置,orient表示横向还是纵向,horizontal和vertical
        legend_opts=opts.LegendOpts(legend_icon='pin',orient='vertical',pos_right='10%'),
        #设置图表主标题,副标题和标题位置
        title_opts=opts.TitleOpts(title = '我喜欢的九位歌手',subtitle='数错了,是十位',pos_left='20%'),
    )
    #设置饼图的颜色,可选项,不设也有默认的颜色。
    pie.set_colors(['blue','red','orange','yellow','green','purple','black','brown','pink','grey'])
    return pie

pie = set_pie()
pie.render('饼图.html')
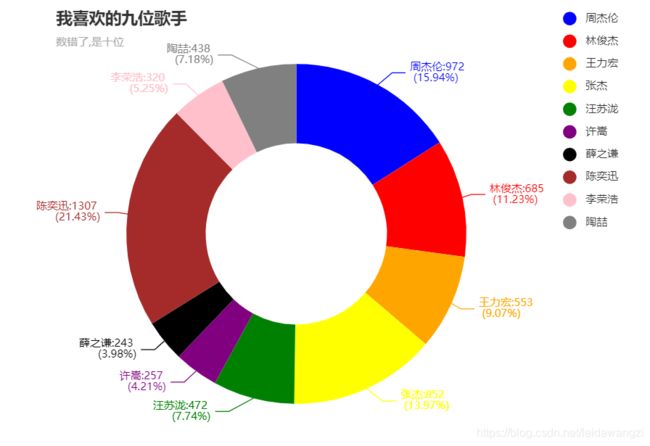
- 不加rosetype参数和radius参数
五、散点图
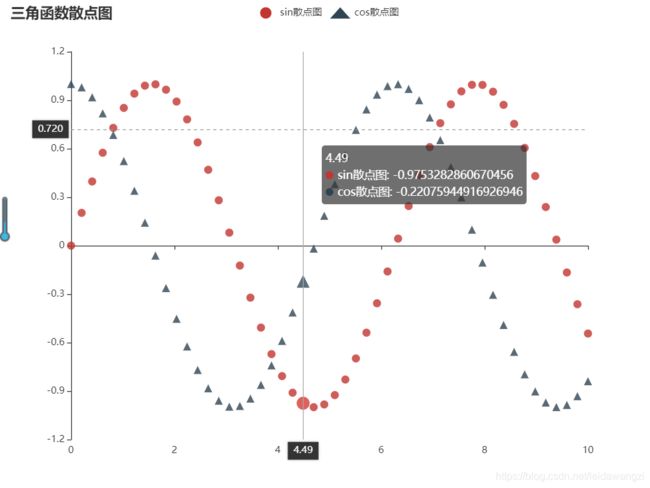
任务:生成sin和cos的散点图
from pyecharts import options as opts
#导入Scatter类
from pyecharts.charts import Scatter
import numpy as np

#散点图的数据类型:x轴和y轴结尾列表
#linspace(start,stop,num),在0-10中返回50个等间距的数
x = np.linspace(0,10,50)
#print(x)
y1 = np.sin(x)
y2 = np.cos(x)

def set_scatter():
    scatter = Scatter(init_opts=opts.InitOpts(width = '800px',height='600px',page_title='散点图'))
    #添加x轴数据
    scatter.add_xaxis(xaxis_data = x)
    #点的形状:symbol参数的取值:'circle', 'rect', 'roundRect', 'triangle', 'diamond', 'pin', 'arrow', 'none'
    scatter.add_yaxis(series_name = 'sin散点图',y_axis = y1,symbol='circle',label_opts=opts.LabelOpts(is_show=False))
    #为了让图更美观简洁,设置标签项不显示is_show = False
    scatter.add_yaxis(series_name = 'cos散点图',y_axis = y2,symbol='triangle',label_opts=opts.LabelOpts(is_show=False))
    scatter.set_global_opts(title_opts=opts.TitleOpts(title = '三角函数散点图'),tooltip_opts=opts.TooltipOpts(trigger='axis',axis_pointer_type='cross'))
    return scatter

scatter = set_scatter()
scatter.render('散点图.html')
六、词云图
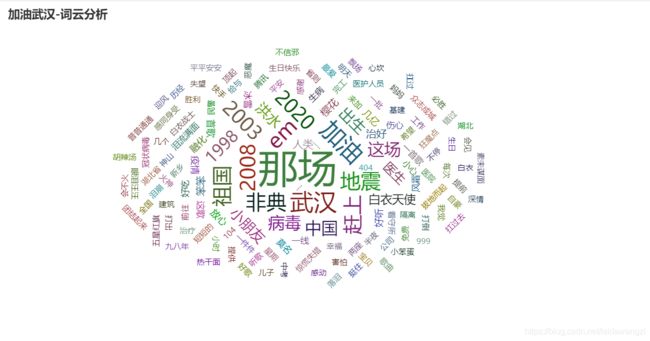
这是我最喜欢的一种图了,不仅美观,简洁,而且直观,印象深刻。
任务
爬取qq音乐评论,数据处理后,绘制词云图
引入模块
import requests
from bs4 import BeautifulSoup
import json
from pyecharts import options as opts
from pyecharts.charts import WordCloud
from jieba.analyse import TFIDF
import jieba
from collections import Counter
数据爬取
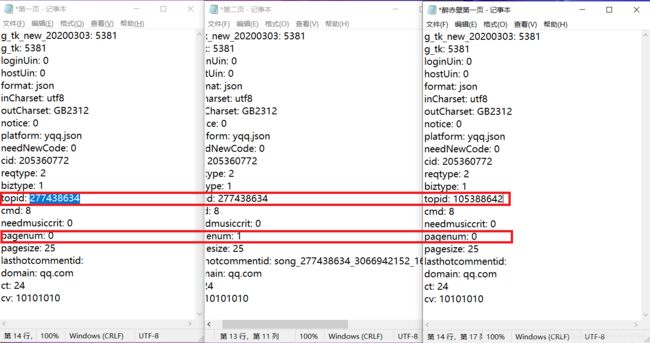
首先进入网页版QQ音乐,打开一首歌的播放页面,在开发者选项中找到关于comment的请求(按照size排序,最大的那个就是)对比后发现不同歌曲topid不同,同一歌曲不同页数,pagenum不同,这样,我们就可以通过构造params来爬取歌曲评论了
your_chioce = input('你想绘制那首歌的评论词云图:')

url_search = 'https://c.y.qq.com/soso/fcgi-bin/client_search_cp?'
headers = {

    'user-agent':'Mozilla/5.0 (Windows NT 10.0; Win64; x64) AppleWebKit/537.36 (KHTML, like Gecko) Chrome/88.0.4324.150 Safari/537.36',
    'referer':'https://y.qq.com/',
    'origin':'https://y.qq.com'
}

params_str = '''
    ct: 24
    qqmusic_ver: 1298
    new_json: 1
    remoteplace: txt.yqq.song
    searchid: 65264922900538759
    t: 0
    aggr: 1
    cr: 1
    catZhida: 1
    lossless: 0
    flag_qc: 0
    p: 1
    n: 10
    w: 林俊杰
    g_tk_new_20200303: 5381
    g_tk: 5381
    loginUin: 0
    hostUin: 0
    format: json
    inCharset: utf8
    outCharset: utf-8
    notice: 0
    platform: yqq.json
    needNewCode: 0
'''

def switch_to_dict(params_f):
    params = {
     }
    p = params_f.replace('\n',',').replace(' ','')
    p_l = p.split(',')
    for i in p_l:
        if i:
            i = i.split(':')
            params[i[0]] = i[1]
    return params

def crawl_topid():
    params = switch_to_dict(params_str)
    params['w'] = your_chioce
    #搜索页面的response
    res_serach = requests.get(url_search,headers = headers,params = params)
    #将json数据转化为dict数据
    json_search = res_serach.json()
    #单曲数量
    top_id = json_search['data']['song']['list'][0]['id']
    return top_id

params_comment = '''
    g_tk_new_20200303: 5381
    g_tk: 5381
    loginUin: 0
    hostUin: 0
    format: json
    inCharset: utf8
    outCharset: GB2312
    notice: 0
    platform: yqq.json
    needNewCode: 0
    cid: 205360772
    reqtype: 2
    biztype: 1
    topid: 277438634
    cmd: 8
    needmusiccrit: 0
    pagenum: 0
    pagesize: 25
    lasthotcommentid:
    domain: qq.com
    ct: 24
    cv: 10101010
'''

url_comment = 'https://c.y.qq.com/base/fcgi-bin/fcg_global_comment_h5.fcg?'
def crawl_comment():
    #创建txt文件,用于写入comment
    file = open('comment.txt','w',encoding='utf-8')
    params = switch_to_dict(params_comment)
    params['topid'] = crawl_topid()
    for i in range(10):
        params['pagenum'] = str(i)
        res_comment = requests.get(url_comment,headers = headers,params = params)
        json_comment = res_comment.json()
        #生成评论的列表
        comment_list = [j['rootcommentcontent'] for j in json_comment['comment']['commentlist']]
        #for z in comment_list:
        file.writelines(comment_list)
    file.close()
#生成txt文件
crawl_comment()
数据处理
file = open('comment.txt','r',encoding='utf-8')
content = file.readlines()
#删除空元素
for i in content:
    if not i :
        del i

words = []
#传入字符串,返回分词的列表
for j in content:
    #提取文本中的关键字
    tfidf = TFIDF()
    tfidf.set_stop_words('data/stopwords.txt')
    words_list = tfidf.extract_tags(sentence = j)
    words.extend(words_list)

#对words列表中的分词进行数量统计
words_dict = dict(Counter(words))

#词云图的数据类型为列表嵌套元组:[(word1, count1), (word2, count2)]
#将words_dict中的数据转换成需要的格式
data_pair = [(k,v) for k,v in words_dict.items() if len(k)<6]
绘制词云图
def set_wordcloud():
    wordcloud = WordCloud()
    wordcloud.add(
        series_name = '词频分析',
        data_pair = data_pair,
        # 词云图轮廓,有 'circle', 'cardioid', 'diamond', 'triangle-forward', 'triangle', 'pentagon', 'star' 可选
        #shape = 'star',
        # 自定义的图片(目前支持 jpg, jpeg, png, ico 的格式.
        # 注:如果使用了 mask_image 之后第一次渲染会出现空白的情况,再刷新一次就可以了(Echarts 的问题)
        #mask_image = '' ,
    )
    wordcloud.set_global_opts(title_opts = opts.TitleOpts(title = '{}-词云分析'.format(your_chioce)))
    return wordcloud

wordcloud = set_wordcloud()
wordcloud.render('十位歌手词云图.html')
图表展示
不同形状的词云图
添加shape参数
wordcloud.add(shape ='')
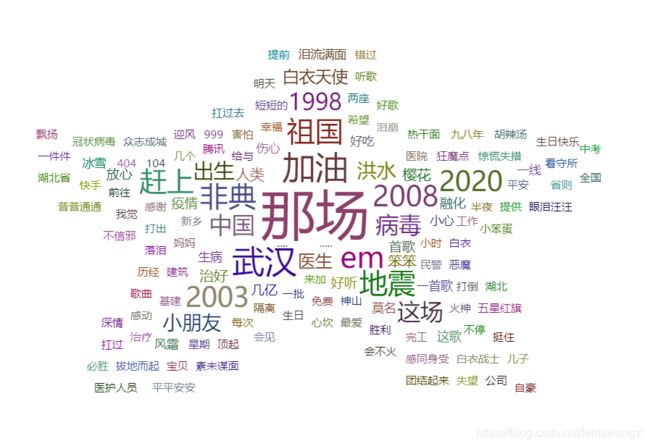
自定义图片搞了好久,都不太像,也不知道什么原因,知道的小伙伴可以教教我。

