KNN分类算法实现鸢尾花数据的分类
1、代码
1、算法描述
鸢尾花数据的特征向量如下:
- sepal_length:花萼长度,单位cm
- sepal_width:花萼宽度,单位cm
- petal_length:花瓣长度,单位cm
- petal_width:花瓣宽度,单位cm
鸢尾花数据的种类(标签)如下:
- setosa(山鸢尾)
- versicolor(杂色鸢尾)
- virginica(弗吉尼亚鸢尾)
本博客主要使用KNN算法对鸢尾花数据进行分类,分类过程如下:
(1)将鸢尾花数据分为训练集和测试集,这两个集合中又将数据分为只包含特征向量的数据和只包含标签的数据。
(2)使用训练集训练出一个分类模型。
(3)使用训练好的模型对传入的鸢尾花数据(只包含特征向量)的标签进行预测。过程是:首先计算测试数据与每个训练数据的距离大小,然后将前K个距离最近的邻居选出来,K个邻居进行投票,根据多数表决规则来确定测试数据的标签类别。
原始投票过程并没有考虑距离这个权重因素,事实上,距离测试集最近的点(训练集)对于该测试集的类别影响较大,我们应该给予它较多的权重,因此,在代码中,我们也使用了第二种KNN分类方式,即加入距离的倒数来作为权重来修正训练集标签的判别。
2、csv数据
测试数据的格式如下,
sepallength	sepalwidth	petallength	petalwidth	class
5.1	3.5	1.4	0.2	Iris-setosa
4.9	3	1.4	0.2	Iris-setosa
4.7	3.2	1.3	0.2	Iris-setosa
4.6	3.1	1.5	0.2	Iris-setosa
5	3.6	1.4	0.2	Iris-setosa
5.4	3.9	1.7	0.4	Iris-setosa
4.6	3.4	1.4	0.3	Iris-setosa
5	3.4	1.5	0.2	Iris-setosa
4.4	2.9	1.4	0.2	Iris-setosa
为了大家能够更好的学习KNN算法,我将这个csv文件放到我博客的资源中,通过下面的链接即可下载:
https://download.csdn.net/download/weixin_43334389/13130463
3、代码
import numpy as np
import pandas as pd

data = pd.read_csv(r"dataset/iris.arff.csv", header=0)
# 对数据进行抽样后显示,默认抽取一条,我们可以通过指定抽取样本的数量
# print(data.sample(10))
# 类别名称映射为数字
data["class"] = data["class"].map({
     "Iris-versicolor": 0, "Iris-setosa": 1, "Iris-virginica": 2})
# 检查是否存在重复值,any()含义是只要data.duplicated()只要有一个是True,它的结果就是True
# 没有将重复的记录进行多次显示
if data.duplicated().any():
    data.drop_duplicates(inplace=True)  # 删除重复值
    print(len(data))
# 查看各个类别的鸢尾花记录,下面的数据一共有147个
print(data["class"].value_counts())


class KNN:
    """
    @desc: 使用KNN实现K近邻算法实现分类
    """

    def __init__(self, k):
        """
        @desc: 初始化
        @param k: 邻居数
        """
        self.k = k

    def fit(self, X, y):
        """
        @desc: 模型训练
        @param X:训练数据,类型为[[特征向量],[]...]
        @param y:类别,类型为 [标签(标签)]
        """
        # 转换为ndarray数组类型,统一处理
        self.X = np.asarray(X)
        self.y = np.asarray(y)

    def predict(self, X):
        """
        @desc:根据传递过来的测试样本进行预测其属于哪一个类别
        @param X: 测试数据,类型为[[特征向量],[]...]
        @return: 预测结果,类型:数组
        """
        X = np.asarray(X)
        # X.shape--> (27, 4)
        print("X.shape-->", X.shape)
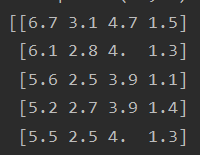
        # [[6.7 3.1 4.7 1.5]
        #  [6.1 2.8 4.  1.3]
        #  [5.6 2.5 3.9 1.1]
        print(X)
        result = []
        # 对narray数据进行遍历,每次取数组中的一行
        for x in X:
            dis = np.sqrt(np.sum((x - self.X) ** 2, axis=1))  # 对于测试机的每一个样本,一次与训练集的所有数据求欧氏距离
            # 返回数组排序后,每个元素在原数组(排序之前的数组)中的索引
            index = dis.argsort()
            # 进行截断,只取前k个元素。(取距离最近的k个元素的索引)
            index = index[:self.k]
            # 查找y的标签(投票法)。返回数组中每个整数元素出现次数,元素必须是非负整数
            count = np.bincount(self.y[index])
            # 返回ndarray中值最大的元素所对应的索引,就是出现次数最多的索引,也就是我们判定的类别
            result.append(count.argmax())
        return np.asarray(result)

    def predict2(self, X):
        """
        @desc: 对样本进行预测,加入权重计算,默认每个权重为1
        实际上,距离某点近的权重大一点,距离远的权重小一点,对于距离不是很均匀,或者差距很大的情况,有很好的使用效果。
        @param X: 测试数据,类型为[[特征向量],[]...]
        @return: 预测结果
        """
        X = np.asarray(X)
        result = []
        for x in X:
            dis = np.sqrt(np.sum((x - self.X) ** 2, axis=1))  # 对于测试机的每隔一个样本,一次与训练集的所有数据求欧氏距离
            index = dis.argsort()  # 返回排序结果的下标
            index = index[:self.k]  # 截取前K个
            # 考虑权重,使用距离的倒数作为权重,对位的权重进行相加求和
            count = np.bincount(self.y[index], weights=1 / dis[index])  # 返回数组中每个整数元素出现次数,元素必须是非负整数
            result.append(count.argmax())  # 返回ndarray中值最大的元素所对应的索引,就是出现次数最多的索引,也就是我们判定的类别
        return np.asarray(result)


# 提取每个类中鸢尾花数据
t0 = data[data["class"] == 0]
t1 = data[data["class"] == 1]
t2 = data[data["class"] == 2]
# 打乱每个类别数据,相当于随机数种子。对每个类别的数据进行洗牌
t0 = t0.sample(len(t0), random_state=0)
t1 = t1.sample(len(t1), random_state=0)
t2 = t2.sample(len(t2), random_state=0)
# 分配训练集和数据集,axis=0表示按纵向方式拼接
# 前40行数据用于训练,40行之后的数据用于测试
train_X = pd.concat([t0.iloc[:40, :-1], t1.iloc[:40, :-1], t2.iloc[:40, :-1]], axis=0)
train_y = pd.concat([t0.iloc[:40, -1], t1.iloc[:40, -1], t2.iloc[:40, -1]], axis=0)
test_X = pd.concat([t0.iloc[40:, :-1], t1.iloc[40:, :-1], t2.iloc[40:, :-1]], axis=0)
test_y = pd.concat([t0.iloc[40:, -1], t1.iloc[40:, -1], t2.iloc[40:, -1]], axis=0)

knn = KNN(k=3)
knn.fit(X=train_X, y=train_y)
# 进行测试,获取测试的结果
result = knn.predict(test_X)
# 分类的准确率
print(np.sum(result == test_y) / len(result))

# "Iris-versicolor":0,"Iris-setosa":1,"Iris-virginica":2
import matplotlib as mpl
import matplotlib.pyplot as plt

plt.figure(figsize=(20, 10))
mpl.rcParams["font.family"] = 'SimHei'  # 默认mpl不支持中文,设置一下支持
mpl.rcParams["axes.unicode_minus"] = False  # 设置中文字体是可以正常显示负号
# 绘制训练集的数据,只选取两个维度的数据进行展示
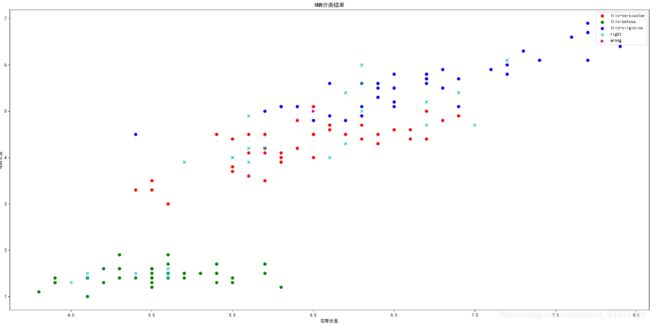
plt.scatter(x=t0["sepallength"][:40], y=t0["petallength"][:40], color='r', label="Iris-versicolor")
plt.scatter(x=t1["sepallength"][:40], y=t1["petallength"][:40], color='g', label="Iris-setosa")
plt.scatter(x=t2["sepallength"][:40], y=t2["petallength"][:40], color='b', label="Iris-virginica")
# 绘制测试集的数据
right = test_X[result == test_y]
wrong = test_X[result != test_y]
plt.scatter(x=right["sepallength"], y=right["petallength"], color='c', label="right", marker="x")
plt.scatter(x=wrong["sepallength"], y=wrong["petallength"], color='m', label="wrong", marker=">")
plt.xlabel('花萼长度')
plt.ylabel('花瓣长度')
plt.title('KNN分类结果')
# 显示图例的位置,默认位置为best
plt.legend(loc='best')
plt.show()
2、分析
1、将CSV文件中的重复值删除
# any()含义是只要data.duplicated()只要有一个是True,它的结果就是True
if data.duplicated().any():
    data.drop_duplicates(inplace=True)  # 删除重复值
duplicated() 方法这里针对于 pd.read_csv(xx) 获取的数据,加入通过下面的方式进行使用,会报错:
data = np.array([1,2,3,4,1])
print(data.duplicated())
2、随机打散数据
t0 = t0.sample(len(t0), random_state=0)
random_state=0 相当于随机数种子,以便打散的数据能够复现。
3、鸢尾花特征数据的拼接
# 取前40行中除了最后一列的数据(类别信息由于预测)
train_X = pd.concat([t0.iloc[:40, :-1], t1.iloc[:40, :-1], t2.iloc[:40, :-1]], axis=0)
# 取最后一列类别数据
train_y = pd.concat([t0.iloc[:40, -1], t1.iloc[:40, -1], t2.iloc[:40, -1]], axis=0)
其中 axis=0 含义如下:

4、原始预测代码
(1)将测试数据转换为narray类型
X = np.asarray(X)
其中,原本的test_x数据类型如下:

经过上面的代码转换之后的数据类型如下:

这样,就可以使用下面的代码对narray数据进行遍历,每次取数组中的一行就行求欧式距离:
 for x in X:
 	dis = np.sqrt(np.sum((x - self.X) ** 2, axis=1))
(2)对测试数据欧式距离进行排序后,返回从小到大的索引值
index = dis.argsort()

# 举例
# [2 0 1 3]
print(np.argsort([2, 3, 1, 4]))
(3)查找y(0,1,2)标签出现的次数
 count = np.bincount(self.y[index])

x = np.array([0, 1, 1, 3, 2, 1, 7])
# bincount给出数组中数据出现的次数(0 ~ 7)
# [1 3 1 1 0 0 0 1]
print(np.bincount(x))
然后根据投票法找到标签出现次数最多的那个,将其作为预测的结果并返回给调用者。
5、改进版预测
这里需要考虑权重,使用距离的倒数作为权重,其中,距离较近的数据权重比较大,然后对位的权重进行相加求和。
count = np.bincount(self.y[index], weights=1 / dis[index])

# 举例
x = np.array([1, 1, 2])
# [0.  2.  0.5]
print(np.bincount(x,weights=1/x))
3、KNN的线性回归
1、算法描述
k近邻法回归算法实现通过花萼长度、宽度和花瓣长度三个特征来预测花瓣的宽度。
2、csv数据
还是采用的鸢尾花数据 iris.arff.csv ,在上面的叙述中,链接已给出,可以通过链接下载。
3、代码
# @Time : 2020/11/21 19:43
# @Description : k近邻法回归算法实现通过花萼长度宽度,花瓣长度三个特征来预测花瓣的宽度
import numpy as np
import pandas as pd

data = pd.read_csv(r"dataset/iris.arff.csv", header=0)
data.drop(["class"], axis=1, inplace=True)
print(data)


class KNN:
    def __init__(self, k):
        self.k = k

    def fit(self, X, y):
        self.X = np.asarray(X)
        self.y = np.asarray(y)

    def predict(self, X):
        X = np.asarray(X)
        result = []
        for x in X:
            dis = np.sqrt(np.sum((x - self.X) ** 2, axis=1))
            index = dis.argsort()
            index = index[:self.k]
            result.append(np.mean(self.y[index]))  # 计算均值
        return np.asarray(result)

    def predict2(self, X):
        """
        @desc:对样本进行预测,考虑权重。权重计算方式:使用每个节点(邻居)距离的倒数/所有节点距离倒数只和。
        @param X:测试数据
        @return:预测结果
        """
        X = np.asarray(X)
        result = []
        for x in X:
            # 计算与训练集的距离,取平方后开方
            dis = np.sqrt(np.sum((x - self.X) ** 2, axis=1))
            index = dis.argsort()
            index = index[:self.k]
            # 最后加一个一很小的数就是为了避免距离为0的情况
            s = np.sum(1 / (dis[index] + 0.001))
            # 距离倒数/总倒数之和
            weight = (1 / (dis[index] + 0.001)) / s
            # 邻居节点标签纸*对应权重相加求和
            result.append(np.sum(self.y[index] * weight))
        return np.asarray(result)


t = data.sample(len(data), random_state=0)
train_X = t.iloc[:120, :-1]
train_y = t.iloc[:120, -1]
test_X = t.iloc[120:, :-1]
test_y = t.iloc[120:, -1]
knn = KNN(k=3)
knn.fit(train_X, train_y)
result = knn.predict(test_X)
result2 = knn.predict2(test_X)
print(result)
print(test_y.values)

print(np.mean(np.sum((result - test_y) ** 2)))
print(np.mean(np.sum((result2 - test_y) ** 2)))

import matplotlib as mpl
import matplotlib.pyplot as plt

mpl.rcParams["font.family"] = "SimHei"
mpl.rcParams["axes.unicode_minus"] = False  # 显示负号

plt.figure(figsize=(10, 5))
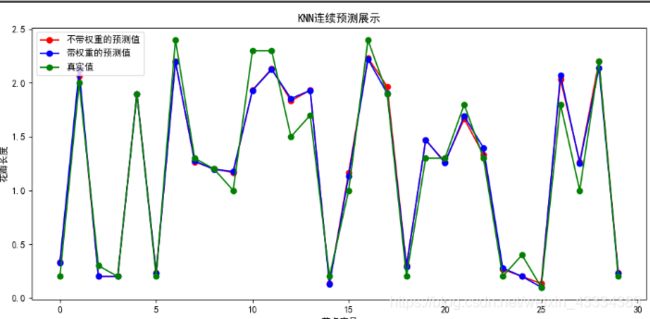
# 红色圆圈表示"不带"权重的预测值
plt.plot(result, 'ro-', label="不带权重的预测值")
# 绿色圆圈表示测试集真实值
plt.plot(result2, 'bo-', label="带权重的预测值")
plt.plot(test_y.values, 'go-', label="真实值")
plt.title('KNN连续预测展示')
plt.xlabel('节点序号')
plt.ylabel('花瓣长度')
plt.legend()
plt.show()


