PyQt5入门(二十七)用PyInstaller打包PyQt5应用 & 使用PyQtGraph进行数据可视化
目录
一.用PyInstaller打包PyQt5应用
二.使用PyQtGraph进行数据可视化
一.用PyInstaller打包PyQt5应用
打包时会自动将依赖库都打打包进去!所以体积不小。。
安装:pip3 install pyinstaller
代码:
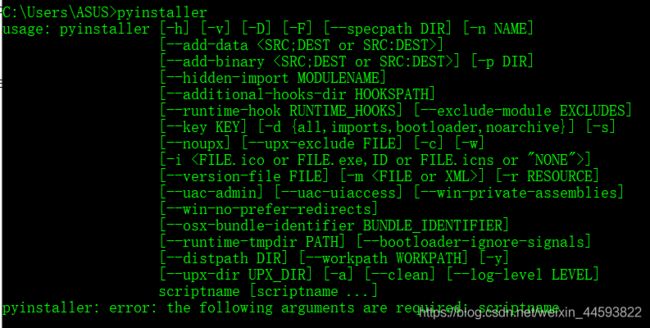
直接在命令行下操作
常用:pyinstaller -Fw python文件名
pyinstaller -Fw Calc. py
-W:不显示终端
-F:将所有的库打包成-个单独的文件
bug:
 from importlib_metadata import PackagePath as _PackagePath
ImportError: cannot import name 'PackagePath' from 'importlib_metadata' (D:\anaconda\lib\site-packages\importlib_metadata\__init__.py)现在pyinstaller是不支持python3.6的,正在完善中,所以可以去GitHub下载最新版的使用,戳这里
下开发版。
尝试了开发版,还是同样的错误!!!心态炸了!!!
看到一句话:一定要把pip升级成最新版的pip在安装pyinstaller哈。要不然可能会出现莫名奇妙的问题。
试过之后,还是不行!!!!
早晨突然看见anaconda没有被激活
于是开始激活,戳这里
激活之后重新打开cmd输入python发现还是出警告。。。。
最后最后,发现是anaconda的问题。。。我换了一个python原生的编译器下的pyinstaller没问题。。。当然之前的问题我还是不会解决。。。
在我的原生python下装上相应的包,再打包即可成功,会在当前目录生成三个文件夹和一个spec文件,exe文件在dist中
二.使用PyQtGraph进行数据可视化
代码:
pyqtgraph_pyqt.py
# -*- coding: utf-8 -*-

# Form implementation generated from reading ui file 'pyqtgraph_pyqt.ui'
#
# Created by: PyQt5 UI code generator 5.9.2
#
# WARNING! All changes made in this file will be lost!

from PyQt5 import QtCore, QtGui, QtWidgets

class Ui_MainWindow(object):
    def setupUi(self, MainWindow):
        MainWindow.setObjectName("MainWindow")
        MainWindow.resize(800, 600)
        self.centralwidget = QtWidgets.QWidget(MainWindow)
        self.centralwidget.setObjectName("centralwidget")
        self.pyqtgraph1 = GraphicsLayoutWidget(self.centralwidget)
        self.pyqtgraph1.setGeometry(QtCore.QRect(10, 10, 721, 251))
        self.pyqtgraph1.setObjectName("pyqtgraph1")
        self.pyqtgraph2 = GraphicsLayoutWidget(self.centralwidget)
        self.pyqtgraph2.setGeometry(QtCore.QRect(10, 290, 501, 281))
        self.pyqtgraph2.setObjectName("pyqtgraph2")
        MainWindow.setCentralWidget(self.centralwidget)
        self.menubar = QtWidgets.QMenuBar(MainWindow)
        self.menubar.setGeometry(QtCore.QRect(0, 0, 800, 22))
        self.menubar.setObjectName("menubar")
        MainWindow.setMenuBar(self.menubar)
        self.statusbar = QtWidgets.QStatusBar(MainWindow)
        self.statusbar.setObjectName("statusbar")
        MainWindow.setStatusBar(self.statusbar)

        self.retranslateUi(MainWindow)
        QtCore.QMetaObject.connectSlotsByName(MainWindow)

    def retranslateUi(self, MainWindow):
        _translate = QtCore.QCoreApplication.translate
        MainWindow.setWindowTitle(_translate("MainWindow", "MainWindow"))

from pyqtgraph import GraphicsLayoutWidget
Graph.py
'''

使用PyQtGraph绘图

pip Install pyqtgraph
'''


from PyQt5.QtCore import pyqtSlot
from PyQt5.QtWidgets import QMainWindow, QApplication
import pyqtgraph as pg
from pyqtgraph_pyqt import Ui_MainWindow
import numpy as np


class MainWindow(QMainWindow, Ui_MainWindow):

    def __init__(self, parent=None):

        super(MainWindow, self).__init__(parent)

        pg.setConfigOption('background', '#f0f0f0')
        pg.setConfigOption('foreground', 'd')


        self.setupUi(self)
        self.draw1()
        self.draw2()


    def draw1(self):

        self.pyqtgraph1.clear()

        '''第一种绘图方式'''
        print(np.random.normal(size=120))
        self.pyqtgraph1.addPlot(title="绘图单条线", y=np.random.normal(size=120), pen=pg.mkPen(color='b', width=2))

        '''第二种绘图方式'''
        plt2 = self.pyqtgraph1.addPlot(title='绘制多条线')

        plt2.plot(np.random.normal(size=150), pen=pg.mkPen(color='r', width=2),
                  name="Red curve")
        plt2.plot(np.random.normal(size=110) + 5, pen=(0, 255, 0), name="Green curve")
        plt2.plot(np.random.normal(size=120) + 10, pen=(0, 0, 255), name="Blue curve")


    def draw2(self):


        plt = self.pyqtgraph2.addPlot(title='绘制条状图')
        x = np.arange(10)
        print(x)
        y1 = np.sin(x)
        y2 = 1.1 * np.sin(x + 1)
        y3 = 1.2 * np.sin(x + 2)

        bg1 = pg.BarGraphItem(x=x, height=y1, width=0.3, brush='r')
        bg2 = pg.BarGraphItem(x=x + 0.33, height=y2, width=0.3, brush='g')
        bg3 = pg.BarGraphItem(x=x + 0.66, height=y3, width=0.3, brush='b')

        plt.addItem(bg1)
        plt.addItem(bg2)
        plt.addItem(bg3)

        self.pyqtgraph2.nextRow()

        p4 = self.pyqtgraph2.addPlot(title="参数图+显示网格")
        x = np.cos(np.linspace(0, 2 * np.pi, 1000))
        y = np.sin(np.linspace(0, 4 * np.pi, 1000))
        p4.plot(x, y, pen=pg.mkPen(color='d', width=2))
        #p4.showGrid(x=True, y=True)  # 显示网格


if __name__ == "__main__":
    import sys

    app = QApplication(sys.argv)
    ui = MainWindow()
    ui.show()
    sys.exit(app.exec_())
运行结果:


