


#include "GraphPage.h"
#include
#include
#include
#include
#include
#include
#include
#include
GraphPage::GraphPage(QChartView *parent)
: QChartView(parent),
poChart(0),
poCallout(0)
{
this->setDragMode(QChartView::NoDrag);
this->setVerticalScrollBarPolicy(Qt::ScrollBarAlwaysOff);
this->setHorizontalScrollBarPolicy(Qt::ScrollBarAlwaysOff);
// chart
poChart = new QChart;
poChart->setMinimumSize(640, 480);
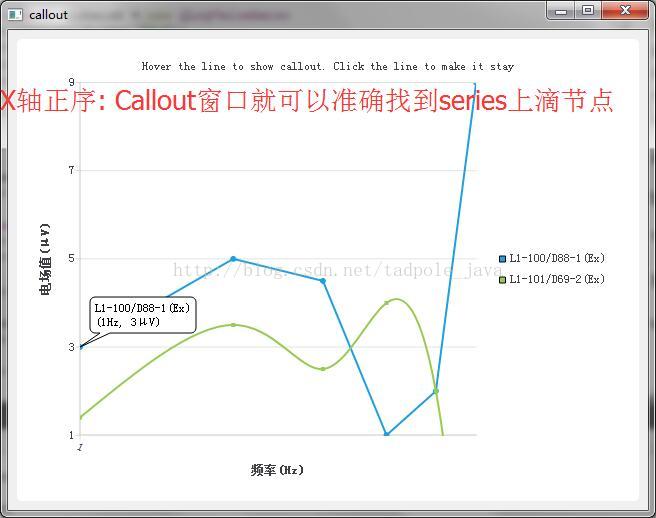
poChart->setTitle("Hover the line to show callout. Click the line to make it stay");
poChart->legend()->setAlignment(Qt::AlignRight);
QLineSeries *poSeries = new QLineSeries;
poSeries->setName("L1-100/D88-1(Ex)");
poSeries->setPointsVisible(true);
poSeries->append(1, 3);
poSeries->append(2, 5);
poSeries->append(3, 4.5);
poSeries->append(4, 1);
poSeries->append(5, 2);
poSeries->append(6, 9);
poChart->addSeries(poSeries);
QSplineSeries *series2 = new QSplineSeries;
series2->setPointsVisible(true);
series2->setName("L1-101/D69-2(Ex)");
series2->append(1, 1.4);
series2->append(2, 3.5);
series2->append(3, 2.5);
series2->append(4, 4);
series2->append(5, 2);
series2->append(6, -6);
poChart->addSeries(series2);
QLogValueAxis *poAxisX = new QLogValueAxis;
poAxisX->setLabelFormat("%g");
poAxisX->setTitleText(QObject::tr("频率(Hz)"));
poAxisX->setBase(10);
poAxisX->setLabelsVisible(true);
poAxisX->setLabelsAngle(26);
poAxisX->setReverse(false);
poChart->addAxis(poAxisX, Qt::AlignBottom);
poSeries->attachAxis(poAxisX);
series2->attachAxis(poAxisX);
QValueAxis *poAxisY = new QValueAxis;
poAxisY->setLabelFormat("%g");
poAxisY->setTitleText(QObject::tr("电场值(\u03BCV)"));
poChart->addAxis(poAxisY, Qt::AlignLeft);
poSeries->attachAxis(poAxisY);
series2->attachAxis(poAxisY);
poChart->setAcceptHoverEvents(true);
setRenderHint(QPainter::Antialiasing);
this->setChart(poChart);
connect(poSeries, SIGNAL(hovered(QPointF, bool)), this, SLOT(TooltipShow(QPointF,bool)));
connect(series2, SIGNAL(hovered(QPointF, bool)), this, SLOT(TooltipShow(QPointF,bool)));
this->MarkersConnect(poChart);
this->setMouseTracking(true);
}
void GraphPage::TooltipShow(QPointF oPoint, bool bState)
{
QLineSeries *poSeries = qobject_cast(sender());
QList aoPointF = poSeries->points();
QList arDst;
for(int i = 0; i < aoPointF.count(); i++)
{
arDst.append( qAbs(aoPointF[i].x() - oPoint.x()) );
}
qreal rMin = arDst[0];
for(int i = 1 ; i < arDst.count(); i++)
{
if(arDst[i]< rMin)
{
rMin = arDst[i];
}
}
QPointF seriesPoint = aoPointF[arDst.indexOf(rMin)];
if (poCallout == 0)
poCallout = new Callout(poChart);
if (bState)
{
qDebug()<<"rMin value:"<setText(QString("%1\n(%2Hz, %3\u03bcV)")
.arg(poSeries->name())
.arg(seriesPoint.x())
.arg(seriesPoint.y()));
poCallout->setAnchor(poChart->mapToPosition(seriesPoint, poSeries));
poCallout->setPos(poChart->mapToPosition(seriesPoint, poSeries) + QPoint(10, -50));
poCallout->setZValue(11);
poCallout->show();
}
else
{
poCallout->hide();
}
}
void GraphPage::resizeEvent(QResizeEvent *event)
{
if (scene())
{
this->scene()->setSceneRect(QRect(QPoint(0, 0), event->size()));
poChart->resize(event->size());
}
QGraphicsView::resizeEvent(event);
}
/***************************************************
* Connect legend
*/
void GraphPage::MarkersConnect(QChart *poChart)
{
/* Connect all markers to handler */
foreach (QLegendMarker* poLegendMarker, poChart->legend()->markers())
{
/* Disconnect possible existing connection to avoid multiple connections */
disconnect(poLegendMarker, SIGNAL(clicked()), this, SLOT(HandleMarkerClicked()));
connect(poLegendMarker, SIGNAL(clicked()), this, SLOT(HandleMarkerClicked()));
}
}
/*******************************************************************************
* Handle Marker Clicked
*/
void GraphPage::HandleMarkerClicked()
{
QLegendMarker* poLegendMarker = qobject_cast (sender());
Q_ASSERT(poLegendMarker);
switch (poLegendMarker->type())
{
case QLegendMarker::LegendMarkerTypeXY:
{
/* Toggle visibility of Series */
poLegendMarker->series()->setVisible(!poLegendMarker->series()->isVisible());
/* Turn legend marker back to visible,
* since hiding poSeries also hides the marker
* and we don't want it to happen now. */
poLegendMarker->setVisible(true);
/* Dim the marker, if series is not visible */
qreal alpha = 1.0;
if (!poLegendMarker->series()->isVisible())
{
alpha = 0.5;
}
QColor oColor;
QBrush oBrush = poLegendMarker->labelBrush();
oColor = oBrush.color();
oColor.setAlphaF(alpha);
oBrush.setColor(oColor);
poLegendMarker->setLabelBrush(oBrush);
oBrush = poLegendMarker->brush();
oColor = oBrush.color();
oColor.setAlphaF(alpha);
oBrush.setColor(oColor);
poLegendMarker->setBrush(oBrush);
QPen oPen = poLegendMarker->pen();
oColor = oPen.color();
oColor.setAlphaF(alpha);
oPen.setColor(oColor);
poLegendMarker->setPen(oPen);
break;
}
default:
{
qDebug() << "Unknown poLegendMarker type";
break;
}
}
}
/****************************************************************************
**
** Copyright (C) 2016 The Qt Company Ltd.
** Contact: https://www.qt.io/licensing/
**
** This file is part of the Qt Charts module of the Qt Toolkit.
**
** $QT_BEGIN_LICENSE:GPL$
** Commercial License Usage
** Licensees holding valid commercial Qt licenses may use this file in
** accordance with the commercial license agreement provided with the
** Software or, alternatively, in accordance with the terms contained in
** a written agreement between you and The Qt Company. For licensing terms
** and conditions see https://www.qt.io/terms-conditions. For further
** information use the contact form at https://www.qt.io/contact-us.
**
** GNU General Public License Usage
** Alternatively, this file may be used under the terms of the GNU
** General Public License version 3 or (at your option) any later version
** approved by the KDE Free Qt Foundation. The licenses are as published by
** the Free Software Foundation and appearing in the file LICENSE.GPL3
** included in the packaging of this file. Please review the following
** information to ensure the GNU General Public License requirements will
** be met: https://www.gnu.org/licenses/gpl-3.0.html.
**
** $QT_END_LICENSE$
**
****************************************************************************/

#include "Callout.h"
#include
#include
#include
#include

Callout::Callout(QGraphicsItem * parent):
    QGraphicsItem(parent)
{
}

QRectF Callout::boundingRect() const
{
    QPointF anchor = mapFromParent(m_anchor);
    QRectF rect;
    rect.setLeft(qMin(m_rect.left(), anchor.x()));
    rect.setRight(qMax(m_rect.right(), anchor.x()));
    rect.setTop(qMin(m_rect.top(), anchor.y()));
    rect.setBottom(qMax(m_rect.bottom(), anchor.y()));
    return rect;
}

void Callout::paint(QPainter *painter, const QStyleOptionGraphicsItem *option, QWidget *widget)
{
    Q_UNUSED(option)
    Q_UNUSED(widget)
    QPainterPath path;
    path.addRoundedRect(m_rect, 5, 5);

    QPointF anchor = mapFromParent(m_anchor);
    if (!m_rect.contains(anchor)) {
        QPointF point1, point2;

        // establish the position of the anchor point in relation to m_rect
        bool above = anchor.y() <= m_rect.top();
        bool aboveCenter = anchor.y() > m_rect.top() && anchor.y() <= m_rect.center().y();
        bool belowCenter = anchor.y() > m_rect.center().y() && anchor.y() <= m_rect.bottom();
        bool below = anchor.y() > m_rect.bottom();

        bool onLeft = anchor.x() <= m_rect.left();
        bool leftOfCenter = anchor.x() > m_rect.left() && anchor.x() <= m_rect.center().x();
        bool rightOfCenter = anchor.x() > m_rect.center().x() && anchor.x() <= m_rect.right();
        bool onRight = anchor.x() > m_rect.right();

        // get the nearest m_rect corner.
        qreal x = (onRight + rightOfCenter) * m_rect.width();
        qreal y = (below + belowCenter) * m_rect.height();
        bool cornerCase = (above && onLeft) || (above && onRight) || (below && onLeft) || (below && onRight);
        bool vertical = qAbs(anchor.x() - x) > qAbs(anchor.y() - y);

        qreal x1 = x + leftOfCenter * 10 - rightOfCenter * 20 + cornerCase * !vertical * (onLeft * 10 - onRight * 20);
        qreal y1 = y + aboveCenter * 10 - belowCenter * 20 + cornerCase * vertical * (above * 10 - below * 20);;
        point1.setX(x1);
        point1.setY(y1);

        qreal x2 = x + leftOfCenter * 20 - rightOfCenter * 10 + cornerCase * !vertical * (onLeft * 20 - onRight * 10);;
        qreal y2 = y + aboveCenter * 20 - belowCenter * 10 + cornerCase * vertical * (above * 20 - below * 10);;
        point2.setX(x2);
        point2.setY(y2);

        path.moveTo(point1);
        path.lineTo(mapFromParent(m_anchor));
        path.lineTo(point2);
        path = path.simplified();
    }
    painter->setBrush(QColor(255, 255, 255));
    painter->drawPath(path);
    painter->drawText(m_textRect, m_text);
}

void Callout::mousePressEvent(QGraphicsSceneMouseEvent *event)
{
    event->setAccepted(true);
}

void Callout::mouseMoveEvent(QGraphicsSceneMouseEvent *event)
{
    if (event->buttons() & Qt::LeftButton)
    {
        setPos(mapToParent(event->pos() - event->buttonDownPos(Qt::LeftButton)));
        event->setAccepted(true);
    }
    else
    {
        event->setAccepted(false);
    }
}

void Callout::setText(const QString &text)
{
    m_text = text;
    QFontMetrics metrics(m_font);
    m_textRect = metrics.boundingRect(QRect(0, 0, 150, 150), Qt::AlignLeft, m_text);
    m_textRect.translate(5, 5);
    prepareGeometryChange();
    m_rect = m_textRect.adjusted(-5, -5, 5, 5);
}

void Callout::setAnchor(QPointF point)
{
    m_anchor = point;
}
/****************************************************************************
**
** Copyright (C) 2016 The Qt Company Ltd.
** Contact: https://www.qt.io/licensing/
**
** This file is part of the Qt Charts module of the Qt Toolkit.
**
** $QT_BEGIN_LICENSE:GPL$
** Commercial License Usage
** Licensees holding valid commercial Qt licenses may use this file in
** accordance with the commercial license agreement provided with the
** Software or, alternatively, in accordance with the terms contained in
** a written agreement between you and The Qt Company. For licensing terms
** and conditions see https://www.qt.io/terms-conditions. For further
** information use the contact form at https://www.qt.io/contact-us.
**
** GNU General Public License Usage
** Alternatively, this file may be used under the terms of the GNU
** General Public License version 3 or (at your option) any later version
** approved by the KDE Free Qt Foundation. The licenses are as published by
** the Free Software Foundation and appearing in the file LICENSE.GPL3
** included in the packaging of this file. Please review the following
** information to ensure the GNU General Public License requirements will
** be met: https://www.gnu.org/licenses/gpl-3.0.html.
**
** $QT_END_LICENSE$
**
****************************************************************************/

#ifndef CALLOUT_H
#define CALLOUT_H

#include
#include

QT_BEGIN_NAMESPACE
class QGraphicsSceneMouseEvent;
QT_END_NAMESPACE

class Callout : public QGraphicsItem
{
public:
    Callout(QGraphicsItem * parent = 0);

    void setText(const QString &text);
    void setAnchor(QPointF point);

    QRectF boundingRect() const;
    void paint(QPainter *painter, const QStyleOptionGraphicsItem *option,QWidget *widget);

protected:
    void mousePressEvent(QGraphicsSceneMouseEvent *event);
    void mouseMoveEvent(QGraphicsSceneMouseEvent *event);

private:
    QString m_text;
    QRectF m_textRect;
    QRectF m_rect;
    QPointF m_anchor;
    QFont m_font;
};

#endif // CALLOUT_H
/****************************************************************************
**
** Copyright (C) 2016 The Qt Company Ltd.
** Contact: https://www.qt.io/licensing/
**
** This file is part of the Qt Charts module of the Qt Toolkit.
**
** $QT_BEGIN_LICENSE:GPL$
** Commercial License Usage
** Licensees holding valid commercial Qt licenses may use this file in
** accordance with the commercial license agreement provided with the
** Software or, alternatively, in accordance with the terms contained in
** a written agreement between you and The Qt Company. For licensing terms
** and conditions see https://www.qt.io/terms-conditions. For further
** information use the contact form at https://www.qt.io/contact-us.
**
** GNU General Public License Usage
** Alternatively, this file may be used under the terms of the GNU
** General Public License version 3 or (at your option) any later version
** approved by the KDE Free Qt Foundation. The licenses are as published by
** the Free Software Foundation and appearing in the file LICENSE.GPL3
** included in the packaging of this file. Please review the following
** information to ensure the GNU General Public License requirements will
** be met: https://www.gnu.org/licenses/gpl-3.0.html.
**
** $QT_END_LICENSE$
**
****************************************************************************/

#ifndef VIEW_H
#define VIEW_H
#include
#include
#include
#include
#include
#include
#include "Callout.h"

QT_BEGIN_NAMESPACE
class QGraphicsScene;
class QMouseEvent;
class QResizeEvent;
QT_END_NAMESPACE

QT_CHARTS_BEGIN_NAMESPACE
class QChart;
QT_CHARTS_END_NAMESPACE
QT_CHARTS_USE_NAMESPACE

class GraphPage: public QChartView
{
    Q_OBJECT

public:
    GraphPage(QChartView *parent = 0);

public slots:
    void TooltipShow(QPointF point, bool state);

protected:
    void resizeEvent(QResizeEvent *event);

private:
    QChart *poChart;
    Callout *poCallout;

    void MarkersConnect(QChart *poChart);

private slots:
    void HandleMarkerClicked();

};

#endif