优衣库案例分析
import pandas as pd
import matplotlib.pyplot as plt
import seaborn as sns
%matplotlib inline
uiq = pd.read_csv('uniqco.csv')
uiq.head()| store_id | city | channel | gender_group | age_group | wkd_ind | product | customer | revenue | order | quant | unit_cost | |
|---|---|---|---|---|---|---|---|---|---|---|---|---|
| 0 | 658 | 深圳 | 线下 | Female | 25-29 | Weekday | 当季新品 | 4 | 796.0 | 4 | 4 | 59 |
| 1 | 146 | 杭州 | 线下 | Female | 25-29 | Weekday | 运动 | 1 | 149.0 | 1 | 1 | 49 |
| 2 | 70 | 深圳 | 线下 | Male | >=60 | Weekday | T恤 | 2 | 178.0 | 2 | 2 | 49 |
| 3 | 658 | 深圳 | 线下 | Female | 25-29 | Weekday | T恤 | 1 | 59.0 | 1 | 1 | 49 |
| 4 | 229 | 深圳 | 线下 | Male | 20-24 | Weekend | 袜子 | 2 | 65.0 | 2 | 3 | 9 |
uiq.info()
'''

RangeIndex: 22293 entries, 0 to 22292
Data columns (total 12 columns):
 #   Column        Non-Null Count  Dtype
---  ------        --------------  -----
 0   store_id      22293 non-null  int64
 1   city          22293 non-null  object
 2   channel       22293 non-null  object
 3   gender_group  22293 non-null  object
 4   age_group     22293 non-null  object
 5   wkd_ind       22293 non-null  object
 6   product       22293 non-null  object
 7   customer      22293 non-null  int64
 8   revenue       22293 non-null  float64
 9   order         22293 non-null  int64
 10  quant         22293 non-null  int64
 11  unit_cost     22293 non-null  int64
dtypes: float64(1), int64(5), object(6)
memory usage: 2.0+ MB

'''
uiq.describe()
store_id customer revenue order quant unit_cost
count 22293.000000 22293.000000 22293.000000 22293.000000 22293.000000 22293.000000
mean 335.391558 1.629480 159.531371 1.651998 1.858072 46.124658
std 230.236167 1.785605 276.254066 1.861480 2.347301 19.124347
min 19.000000 1.000000 -0.660000 1.000000 1.000000 9.000000
25% 142.000000 1.000000 64.000000 1.000000 1.000000 49.000000
50% 315.000000 1.000000 99.000000 1.000000 1.000000 49.000000
75% 480.000000 2.000000 175.000000 2.000000 2.000000 49.000000
max 831.000000 58.000000 12538.000000 65.000000 84.000000 99.000000不同产品的销售情况
#参数1 数据,uiq代表的是传入的数据; 参数index 数据透视表行显示哪些数据 values 值计算哪些列,aggfunc聚合函数,quant代表一共卖了多少件
sales_table=pd.pivot_table(uiq,index=["product"],values=["order","quant","revenue"],aggfunc="sum") #uiq代表的是传入的数据,quant代表一共卖了多少件
sales_table.sort_values(['revenue'],ascending=False)
sales_table| order | quant | revenue | |
|---|---|---|---|
| product | |||
| T恤 | 16792 | 18425 | 1538744.84 |
| 当季新品 | 4835 | 5338 | 590664.88 |
| 毛衣 | 1258 | 1356 | 245630.80 |
| 牛仔裤 | 2292 | 2432 | 246127.48 |
| 短裤 | 2375 | 2821 | 107485.88 |
| 袜子 | 2775 | 3639 | 127731.36 |
| 裙子 | 980 | 995 | 137302.78 |
| 运动 | 1538 | 1794 | 118059.68 |
| 配件 | 3983 | 4622 | 444685.15 |
#所有列名显示
sales_table.columns
#Index(['order', 'quant', 'revenue'], dtype='object')
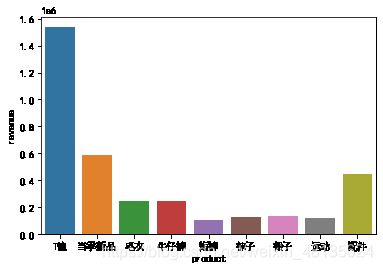
不同产品的销售额柱状图展示
sales_table.reset_index(inplace=True)
sns.barplot(x="product",y="revenue",data=sales_table) #barplot 绘制柱状图
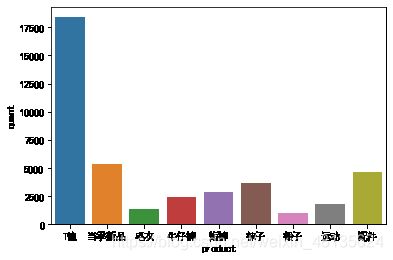
根据产品销售数量排序并绘制柱状图
sales_table.sort_values(["quant"],ascending=False)| product | order | quant | revenue | |
|---|---|---|---|---|
| 0 | T恤 | 16792 | 18425 | 1538744.84 |
| 1 | 当季新品 | 4835 | 5338 | 590664.88 |
| 8 | 配件 | 3983 | 4622 | 444685.15 |
| 5 | 袜子 | 2775 | 3639 | 127731.36 |
| 4 | 短裤 | 2375 | 2821 | 107485.88 |
| 3 | 牛仔裤 | 2292 | 2432 | 246127.48 |
| 7 | 运动 | 1538 | 1794 | 118059.68 |
| 2 | 毛衣 | 1258 | 1356 | 245630.80 |
| 6 | 裙子 | 980 | 995 | 137302.78 |
sns.barplot(x="product",y="quant",data=sales_table)
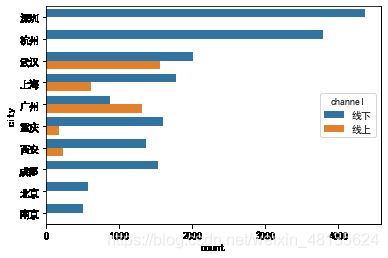
顾客喜欢的购买方式
uiq["channel"].value_counts()
'''
线下    18403
线上     3890
Name: channel, dtype: int64
'''

#使用countplot,count是对数据加总,plot将数据进行可视化.hue分类
sns.countplot(y='city',hue="channel",data=uiq,order=uiq["city"].value_counts().index)
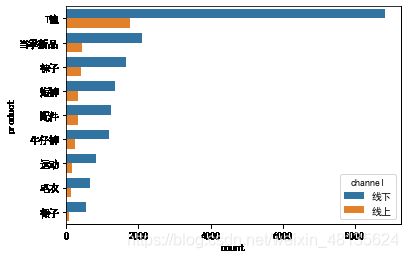
不同产品的购买方式
sns.countplot(y="product",hue="channel",data=uiq,order=uiq["product"].value_counts().index)
不同时间的购买方式,周末和工作日
sns.countplot(y="wkd_ind",hue="channel",data=uiq,order=uiq["wkd_ind"].value_counts().index)#周末和工作日的购买件数
uiq["wkd_ind"].value_counts()
'''
Weekday 12465
Weekend 9828
Name: wkd_ind, dtype: int64
'''结论:平均到每一天,周末的销售量更好一点儿
不同城市在不同类别产品的销售情况
pd.pivot_table(uiq,index=["product"],columns=["city"],values=["quant"],aggfunc="sum")| quant | ||||||||||
|---|---|---|---|---|---|---|---|---|---|---|
| city | 上海 | 北京 | 南京 | 广州 | 成都 | 杭州 | 武汉 | 深圳 | 西安 | 重庆 |
| product | ||||||||||
| T恤 | 2118 | 800 | 568 | 1681 | 1079 | 3100 | 2964 | 3697 | 1145 | 1273 |
| 当季新品 | 550 | 188 | 266 | 459 | 329 | 840 | 862 | 1126 | 281 | 437 |
| 毛衣 | 131 | 37 | 44 | 149 | 92 | 238 | 202 | 248 | 105 | 110 |
| 牛仔裤 | 307 | 46 | 52 | 194 | 178 | 388 | 415 | 477 | 152 | 223 |
| 短裤 | 306 | 87 | 49 | 266 | 179 | 456 | 490 | 608 | 174 | 206 |
| 袜子 | 370 | 123 | 117 | 379 | 240 | 662 | 568 | 735 | 186 | 259 |
| 裙子 | 102 | 27 | 26 | 107 | 77 | 163 | 165 | 201 | 71 | 56 |
| 运动 | 171 | 31 | 17 | 174 | 125 | 351 | 282 | 364 | 118 | 161 |
| 配件 | 550 | 138 | 126 | 406 | 225 | 777 | 755 | 1046 | 260 | 339 |
不同城市在不同年龄段的销售额情况
pd.pivot_table(uiq,index=["age_group"],columns=["city"],values=["revenue"],aggfunc="sum")#(aggfunc="max"最大值,数据可以经过改动,查找自己需要的数据)
| revenue | ||||||||||
|---|---|---|---|---|---|---|---|---|---|---|
| city | 上海 | 北京 | 南京 | 广州 | 成都 | 杭州 | 武汉 | 深圳 | 西安 | 重庆 |
| age_group | ||||||||||
| 20-24 | 47532.55 | 23462.56 | 23539.31 | 38387.75 | 23012.36 | 104246.43 | 91602.19 | 120307.87 | 43624.05 | 36374.34 |
| 25-29 | 73727.05 | 34565.05 | 28245.99 | 66196.80 | 41078.57 | 127612.60 | 151480.96 | 171336.77 | 43540.34 | 45642.92 |
| 30-34 | 91942.37 | 28044.47 | 29427.29 | 75522.14 | 57381.77 | 126068.58 | 112524.17 | 156983.93 | 39325.07 | 64677.57 |
| 35-39 | 70375.56 | 21821.10 | 9923.13 | 54666.58 | 34745.49 | 100718.35 | 91052.62 | 110862.52 | 35028.55 | 51408.82 |
| 40-44 | 26845.36 | 5167.82 | 6179.15 | 24948.03 | 15606.07 | 35781.94 | 43639.25 | 50526.00 | 13709.00 | 20025.20 |
| 45-49 | 14112.00 | 3211.00 | 15909.39 | 17207.60 | 6655.27 | 24754.69 | 22736.34 | 28702.60 | 8212.00 | 10325.48 |
| 50-54 | 25330.45 | 2416.00 | 2415.00 | 7407.38 | 3997.00 | 10608.78 | 15957.88 | 19030.58 | 5051.56 | 6564.00 |
| 55-59 | 7696.52 | 1968.31 | 971.00 | 7652.00 | 6167.00 | 10472.00 | 12360.43 | 15046.70 | 3971.46 | 4300.32 |
| <20 | 5568.60 | 2190.00 | 2519.00 | 6744.50 | 4306.57 | 18956.61 | 11968.18 | 18179.28 | 5020.99 | 5675.00 |
| >=60 | 24205.27 | 7533.31 | 3625.67 | 17858.71 | 14603.76 | 28828.51 | 34645.76 | 39649.57 | 13063.60 | 17431.00 |
| Unkown | 2486.00 | 79.00 | 396.00 | 1533.00 | 636.00 | 1470.00 | 1810.00 | 2497.86 | 228.00 | 1068.00 |
城市不同类别产品的对比图
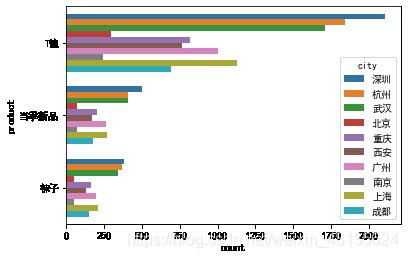
sns.countplot(y="product",hue="city",data=uiq,order=uiq["product"].value_counts().index[:3])
不同城市年龄区间的销售额情况
city_age_group=pd.pivot_table(uiq,index=["age_group"],columns=["city"],values=["revenue"],aggfunc='sum')

city_age_group.index
'''
Index(['20-24', '25-29', '30-34', '35-39', '40-44', '45-49', '50-54', '55-59',
       '<20', '>=60', 'Unkown'],
      dtype='object', name='age_group')
'''

city_age_group.columns
'''
MultiIndex([('revenue', '上海'),
            ('revenue', '北京'),
            ('revenue', '南京'),
            ('revenue', '广州'),
            ('revenue', '成都'),
            ('revenue', '杭州'),
            ('revenue', '武汉'),
            ('revenue', '深圳'),
            ('revenue', '西安'),
            ('revenue', '重庆')],
           names=[None, 'city'])
'''

city_age_group| revenue | ||||||||||
|---|---|---|---|---|---|---|---|---|---|---|
| city | 上海 | 北京 | 南京 | 广州 | 成都 | 杭州 | 武汉 | 深圳 | 西安 | 重庆 |
| age_group | ||||||||||
| 20-24 | 47532.55 | 23462.56 | 23539.31 | 38387.75 | 23012.36 | 104246.43 | 91602.19 | 120307.87 | 43624.05 | 36374.34 |
| 25-29 | 73727.05 | 34565.05 | 28245.99 | 66196.80 | 41078.57 | 127612.60 | 151480.96 | 171336.77 | 43540.34 | 45642.92 |
| 30-34 | 91942.37 | 28044.47 | 29427.29 | 75522.14 | 57381.77 | 126068.58 | 112524.17 | 156983.93 | 39325.07 | 64677.57 |
| 35-39 | 70375.56 | 21821.10 | 9923.13 | 54666.58 | 34745.49 | 100718.35 | 91052.62 | 110862.52 | 35028.55 | 51408.82 |
| 40-44 | 26845.36 | 5167.82 | 6179.15 | 24948.03 | 15606.07 | 35781.94 | 43639.25 | 50526.00 | 13709.00 | 20025.20 |
| 45-49 | 14112.00 | 3211.00 | 15909.39 | 17207.60 | 6655.27 | 24754.69 | 22736.34 | 28702.60 | 8212.00 | 10325.48 |
| 50-54 | 25330.45 | 2416.00 | 2415.00 | 7407.38 | 3997.00 | 10608.78 | 15957.88 | 19030.58 | 5051.56 | 6564.00 |
| 55-59 | 7696.52 | 1968.31 | 971.00 | 7652.00 | 6167.00 | 10472.00 | 12360.43 | 15046.70 | 3971.46 | 4300.32 |
| <20 | 5568.60 | 2190.00 | 2519.00 | 6744.50 | 4306.57 | 18956.61 | 11968.18 | 18179.28 | 5020.99 | 5675.00 |
| >=60 | 24205.27 | 7533.31 | 3625.67 | 17858.71 | 14603.76 | 28828.51 | 34645.76 | 39649.57 | 13063.60 | 17431.00 |
| Unkown | 2486.00 | 79.00 | 396.00 | 1533.00 | 636.00 | 1470.00 | 1810.00 | 2497.86 | 228.00 | 1068.00 |
city_age_group1=pd.DataFrame(city_age_group.values,index=['20-24', '25-29', '30-34', '35-39', '40-44', '45-49', '50-54', '55-59',
       '<20', '>=60', 'Unkown'],columns=['上海','北京','南京','广州','成都','杭州','武汉','深圳','西安','重庆'])

city_age_group1["上海"].sort_values(ascending=False)
'''
30-34     91942.37
25-29     73727.05
35-39     70375.56
20-24     47532.55
40-44     26845.36
50-54     25330.45
>=60      24205.27
45-49     14112.00
55-59      7696.52
<20        5568.60
Unkown     2486.00
Name: 上海, dtype: float64
'''

city_age_group1["南京"].sort_values(ascending=False)
'''
30-34     29427.29
25-29     28245.99
20-24     23539.31
45-49     15909.39
35-39      9923.13
40-44      6179.15
>=60       3625.67
<20        2519.00
50-54      2415.00
55-59       971.00
Unkown      396.00
Name: 南京, dtype: float64
'''
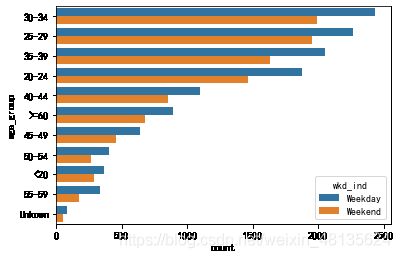
不同年龄段在时间上的消费的习惯
sns.countplot(y="age_group",hue="wkd_ind",data=uiq,order=uiq["age_group"].value_counts().index)
销售额和成本之间的关系
uiq[["revenue","unit_cost"]].corr()| revenue | unit_cost | |
|---|---|---|
| revenue | 1.00000 | 0.14844 |
| unit_cost | 0.14844 | 1.00000 |
uiq["product"].unique()
#array(['当季新品', '运动', 'T恤', '袜子', '短裤', '牛仔裤', '毛衣', '配件', '裙子'],
      dtype=object)
uiq[uiq["product"]=="牛仔裤"]["unit_cost"].unique() #产品单价成本计算
#array([69], dtype=int64)uiq["price"]=uiq["revenue"]/uiq["quant"]
uiq["price"]
'''
0 199.000000
1 149.000000
2 89.000000
3 59.000000
4 21.666667
...
22288 40.000000
22289 79.000000
22290 79.000000
22291 26.000000
22292 79.000000
Name: price, Length: 22293, dtype: float64
'''uiq["income"]=uiq["price"]-uiq["unit_cost"] #income是毛利润
uiq| store_id | city | channel | gender_group | age_group | wkd_ind | product | customer | revenue | order | quant | unit_cost | price | income | |
|---|---|---|---|---|---|---|---|---|---|---|---|---|---|---|
| 0 | 658 | 深圳 | 线下 | Female | 25-29 | Weekday | 当季新品 | 4 | 796.0 | 4 | 4 | 59 | 199.000000 | 140.000000 |
| 1 | 146 | 杭州 | 线下 | Female | 25-29 | Weekday | 运动 | 1 | 149.0 | 1 | 1 | 49 | 149.000000 | 100.000000 |
| 2 | 70 | 深圳 | 线下 | Male | >=60 | Weekday | T恤 | 2 | 178.0 | 2 | 2 | 49 | 89.000000 | 40.000000 |
| 3 | 658 | 深圳 | 线下 | Female | 25-29 | Weekday | T恤 | 1 | 59.0 | 1 | 1 | 49 | 59.000000 | 10.000000 |
| 4 | 229 | 深圳 | 线下 | Male | 20-24 | Weekend | 袜子 | 2 | 65.0 | 2 | 3 | 9 | 21.666667 | 12.666667 |
| ... | ... | ... | ... | ... | ... | ... | ... | ... | ... | ... | ... | ... | ... | ... |
| 22288 | 146 | 杭州 | 线下 | Female | 30-34 | Weekday | 短裤 | 1 | 80.0 | 1 | 2 | 19 | 40.000000 | 21.000000 |
| 22289 | 430 | 成都 | 线下 | Female | 25-29 | Weekend | T恤 | 1 | 79.0 | 1 | 1 | 49 | 79.000000 | 30.000000 |
| 22290 | 449 | 武汉 | 线下 | Female | 35-39 | Weekday | T恤 | 1 | 158.0 | 1 | 2 | 49 | 79.000000 | 30.000000 |
| 22291 | 758 | 杭州 | 线下 | Female | 20-24 | Weekday | 袜子 | 1 | 26.0 | 1 | 1 | 9 | 26.000000 | 17.000000 |
| 22292 | 616 | 成都 | 线下 | Male | 30-34 | Weekday | 当季新品 | 1 | 79.0 | 1 | 1 | 59 | 79.000000 | 20.000000 |
22293 rows × 14 columns
