图解python.pandas groupby & pivot_table
-
- 图解:pandas groupby( )
-
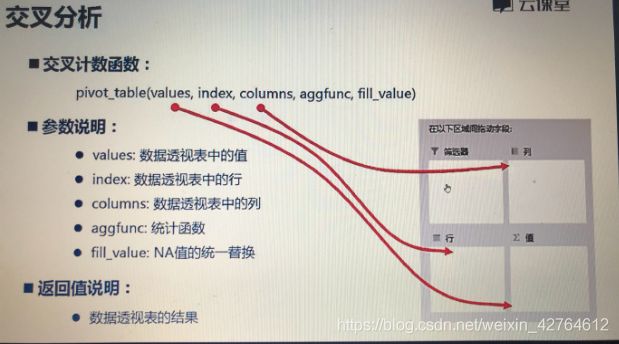
- 图解:pandas pivot_table( )
-
- 常用的统计函数:
图解:pandas groupby( )

pandas groupby( )代码
import pandas as pd
test_df = pd.DataFrame({ 'col_1':['a', 'a', 'b', 'a', 'a', 'b', 'c', 'a', 'c'],
                         'col_2':['d', 'd', 'd', 'e', 'f', 'e', 'd', 'f', 'f'],
                         'col_3':[ 1,  2,  3,   1,  4,  5,  6,  4,  5]})
test_df  :
     col_1   col_2   col_3

0     a         d         1
1     a         d         2
2     b         d         3
3     a         e         1
4     a         f         4
5     b         e         5
6     c         d         6
7     a         f         4
8     c         f         5

gp_df = test_df.groupby(by=['col_1','col_2'])['col_3'].agg({'c3_sum':sum})
gp_df:

                             c3_sum

   col_1      col_2
      a           d             3
                  e             1
                  f             8
      b           d             3
                  e             5
      c           d             6
                  f             5

gp_df.inde x:
MultiIndex(levels=[['a', 'b', 'c'], ['d', 'e', 'f']],
                   labels=[[0, 0, 0, 1, 1, 2, 2], [0, 1, 2, 0, 1, 0, 2]],
                   names=['col_1', 'col_2'])


gp_df.columns:
Index(['c3_sum'], dtype='object')
图解:pandas pivot_table( )

pandas pivot_table( )代码
import pandas as pd
test_df = pd.DataFrame({ 'col_1':['a', 'a', 'b', 'a', 'a', 'b', 'c', 'a', 'c'],
                         'col_2':['d', 'd', 'd', 'e', 'f', 'e', 'd', 'f', 'f'],
                         'col_3':[ 1,  2,  3,   1,  4,  5,  6,  4,  5]})

test_df  :
     col_1   col_2   col_3

0     a         d         1
1     a         d         2
2     b         d         3
3     a         e         1
4     a         f         4
5     b         e         5
6     c         d         6
7     a         f         4
8     c         f         5

pt_df = test_df.pivot_table(values='col_3', index='col_1', columns='col_2', aggfunc=sum)
pt_df:

col_2     d       e        f
col_1
a         3.0     1.0     8.0
b         3.0     5.0     NaN
c         6.0     NaN     5.0

pt_df.index:
Index(['a', 'b', 'c'], dtype='object', name='col_1')

pt_df.columns:
Index(['d', 'e', 'f'], dtype='object', name='col_2')
常用的统计函数:
size:   聚合后样本数
sum:    聚合后样本求和
mean:   聚合后样本求均值
count:  聚合后样本计数 注:在使用count的时候应加上引号 'count_col_name' : 'count'

