OpenCV-Python形态变换、图像金字塔、轮廓属性、直方图
1. Morphological Transformations(形态变换)
(1)侵蚀(丢弃边缘,变小)
(2)腐蚀(增加边缘,变大)
(3)打开(对轮廓外部的噪点可丢弃)
(4)关闭(对轮廓内部的噪点可丢弃)
(5)形态梯度(Morphological Gradient 侵蚀与腐蚀的差值图)
(6)Top Hat(原图与打开之间的差值图)
(7)Black Hat(原图与关闭之间的差制图)
获取不同的卷积核:
cv2.getStructuringElement(cv2.MORPH_RECT,(5,5))
第一个参数:卷积核形状
第二个参数:卷积核大小
2. Image Pyramids(图像金字塔)
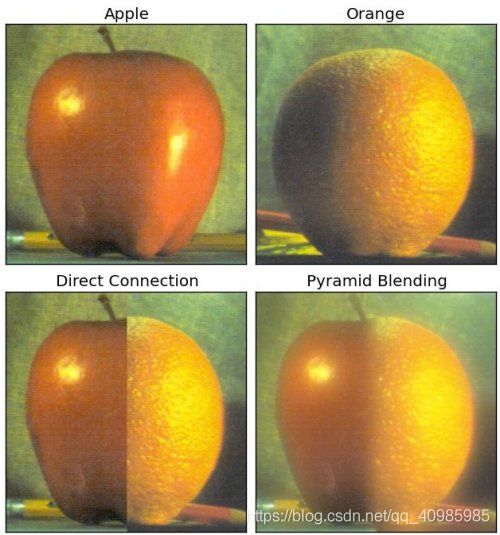
具有不同分辨率的图像集称为“图像金字塔”(因为当它们堆叠在堆栈中时,底部最大的图像和顶部最小的图像看起来像金字塔)。
高斯金字塔中的较高级别(低分辨率)是通过删除较低级别(较高分辨率)图像中的连续行和列而形成的。然后,较高级别的每个像素由基础级别的5个像素的贡献与高斯权重形成。通过这样做,M×N图像变成M / 2×N / 2图像。因此面积减少到原始面积的四分之一。它称为八度。当我们在金字塔中越靠上时(即分辨率下降),这种模式就会继续。同样,在扩展时,每个级别的面积变为4倍。我们可以使用cv2.pyrDown()和cv2.pyrUp()函数找到高斯金字塔。
分类:
(1)高斯金字塔
(2)拉普拉斯金字塔(高斯金字塔相邻俩层之间的差值构成)
拉普拉斯金字塔由高斯金字塔形成。没有专用功能。拉普拉斯金字塔图像仅像边缘图像。它的大多数元素为零。它们用于图像压缩。拉普拉斯金字塔的层由高斯金字塔的层与高斯金字塔的高层的扩展版本之间的差形成。
import cv2
import numpy as np
from matplotlib import pyplot as plt

A = cv2.imread('D:/imageProcessing/input/flower3.jpg')
B = cv2.imread('D:/imageProcessing/input/flower2.jpg')

# 由于大小不同的图片后边拉普拉斯算子相减会报错 先缩放到同样大小
A = cv2.resize(A, (32 * 32, 32 * 32))
B = cv2.resize(B, (32 * 32, 32 * 32))
print(A.shape)
print(B.shape)

# generate Gaussian pyramid for A
G = A.copy()
gpA = [G]
for i in range(6):
    G = cv2.pyrDown(G)
    gpA.append(G)

# generate Gaussian pyramid for B
G = B.copy()
gpB = [G]
for i in range(6):
    G = cv2.pyrDown(G)
    g = cv2.cvtColor(G, cv2.COLOR_BGR2RGB)
    plt.subplot(1, 6, (i + 1)), plt.imshow(g), plt.title('gpB' + str(i))
    gpB.append(G)
plt.show()

# generate Laplacian Pyramid for A
lpA = [gpA[5]]
for i in range(5, 0, -1):
    GE = cv2.pyrUp(gpA[i])
    L = cv2.subtract(gpA[i - 1], GE)
    lpA.append(L)

# generate Laplacian Pyramid for B
lpB = [gpB[5]]
for i in range(5, 0, -1):
    GE = cv2.pyrUp(gpB[i])
    L = cv2.subtract(gpB[i - 1], GE)
    l = cv2.cvtColor(L, cv2.COLOR_BGR2RGB)
    plt.subplot(1, 6, (i + 1)), plt.imshow(l), plt.title('lpB' + str(i))
    lpB.append(L)
plt.show()

# Now add left and right halves of images in each level
LS = []
for la, lb in zip(lpA, lpB):
    rows, cols, dpt = la.shape
    ls = np.hstack((la[:, 0:int(cols / 2)], lb[:, int(cols / 2):]))
    LS.append(ls)

# now reconstruct
ls_ = LS[0]
for i in range(1, 6):
    ls_ = cv2.pyrUp(ls_)
    ls_ = cv2.add(ls_, LS[i])

# image with direct connecting each half
real = np.hstack((A[:, :int(cols / 2)], B[:, int(cols / 2):]))


# 由于python-opencv图片是BGR通道,matplot展示需要是RGB,先转换下颜色空间
ls_ = cv2.cvtColor(ls_, cv2.COLOR_BGR2RGB)
real = cv2.cvtColor(real, cv2.COLOR_BGR2RGB)
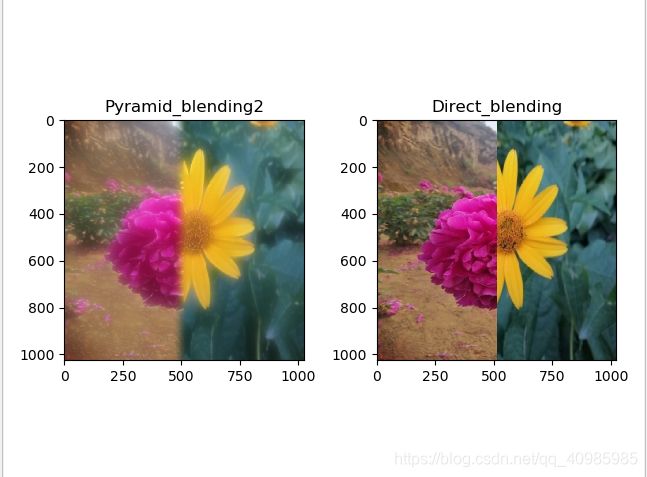
plt.subplot(121), plt.imshow(ls_), plt.title('Pyramid_blending2')
plt.subplot(122), plt.imshow(real), plt.title('Direct_blending')
plt.show()
3. Contours(轮廓)
1. 轮廓是什么?怎么查找绘制?
2. 轮廓的特征(例如面积,周长,质心,边界框等)的计算
3. 轮廓的更多方法:层次等
轮廓可以简单地解释为连接具有相同颜色或强度的所有连续点(沿边界)的曲线。轮廓是用于形状分析以及对象检测和识别的有用工具。
查找轮廓 cv2.findContours
绘制轮廓 cv2.drawContours
image, contours, hierarchy = cv2.findContours(thresh,cv2.RETR_TREE,cv2.CHAIN_APPROX_SIMPLE)
入参
- thresh: 源图像
- cv2.RETR_TREE:轮廓检索模式
- cv2.CHAIN_APPROX_SIMPLE:轮廓近似方法,如果传递cv2.CHAIN_APPROX_NONE,则将存储所有边界点。如果传递cv2.CHAIN_APPROX_SIMPLE,则只是返回角点;(如矩形返回4个点但前一个方法返回所有组成的点;)
img = cv2.drawContours(img, contours, -1, (0,255,0), 3)
- img: 要绘制的源图像
- contours: 绘制的轮廓
- -1:绘制所有的轮廓,3绘制出第四个轮廓
- (0,255,0):颜色BGR 绿色
- 3:画笔的粗细
特征的计算: cv2.moments()提供了所有计算出的矩值的字典。
-
质心:cx = int(M[‘m10’]/M[‘m00’])
cy = int(M[‘m01’]/M[‘m00’]) -
周长:perimeter = cv2.arcLength(cnt,True)
-
面积:area = cv2.contourArea(cnt) 或者 M[‘m00’]
-
轮廓近似
根据我们指定的精度,它可以将轮廓形状近似为顶点数量较少的其他形状。
epsilon = 0.1*cv2.arcLength(cnt,True)
approx = cv2.approxPolyDP(cnt,epsilon,True)
表示以110%的周长拟合轮廓; -
外接凸包:hull = cv2.convexHull(points[, hull[, clockwise[, returnPoints]]
-
检查凸度:k = cv2.isContourConvex(cnt) 返回True或者False
-
直边界外接矩形(外接矩形):
x,y,w,h = cv2.boundingRect(cnt)
img = cv2.rectangle(img,(x,y),(x+w,y+h),(0,255,0),2) -
面积最小外接矩形():
rect = cv2.minAreaRect(cnt)
box = cv2.boxPoints(rect)
box = np.int0(box)
im = cv2.drawContours(im,[box],0,(0,0,255),2) -
最小外接圆:
(x,y),radius = cv2.minEnclosingCircle(cnt)
center = (int(x),int(y))
radius = int(radius)
img = cv2.circle(img,center,radius,(0,255,0),2) -
拟合椭圆
ellipse = cv2.fitEllipse(cnt)
im = cv2.ellipse(im,ellipse,(0,255,0),2) -
拟合线
rows,cols = img.shape[:2]
[vx,vy,x,y] = cv2.fitLine(cnt, cv2.DIST_L2,0,0.01,0.01)
lefty = int((-x*vy/vx) + y)
righty = int(((cols-x)*vy/vx)+y)
img = cv2.line(img,(cols-1,righty),(0,lefty),(0,255,0),2)
轮廓的特性进阶:
-
宽高比:
x,y,w,h = cv2.boundingRect(cnt)
aspect_ratio = float(w)/h -
扩充:是轮廓占其外接矩形的面积比;
area = cv2.contourArea(cnt)
x,y,w,h = cv2.boundingRect(cnt)
rect_area = w*h
extent = float(area)/rect_area -
坚固度:是轮廓占其凸包的面积比;
area = cv2.contourArea(cnt)
hull = cv2.convexHull(cnt)
hull_area = cv2.contourArea(hull)
solidity = float(area)/hull_area -
等效直径:是面积与轮廓面积相同的圆的直径。
area = cv2.contourArea(cnt)
equi_diameter = np.sqrt(4*area/np.pi)
-Orientation方向:是物体指向的角度。以下方法还给出了主轴和副轴的长度。
(x,y),(MA,ma),angle = cv2.fitEllipse(cnt)
-
蒙版和像素点:构成某轮廓的所有点
mask = np.zeros(imgray.shape,np.uint8)
cv2.drawContours(mask,[cnt],0,255,-1)
pixelpoints = np.transpose(np.nonzero(mask))
#pixelpoints = cv2.findNonZero(mask) -
最大值,最小值及位置
min_val, max_val, min_loc, max_loc = cv2.minMaxLoc(imgray,mask = mask) -
平均强度(灰度模式下的平均颜色或者说平均强度)
mean_val = cv2.mean(im,mask = mask) -
极端点:是指对象的最顶部,最底部,最右侧和最左侧的点;
leftmost = tuple(cnt[cnt[:,:,0].argmin()][0])
rightmost = tuple(cnt[cnt[:,:,0].argmax()][0])
topmost = tuple(cnt[cnt[:,:,1].argmin()][0])
bottommost = tuple(cnt[cnt[:,:,1].argmax()][0])
4. Histograms(直方图)
(1)什么是直方图?直方图的查找,绘制?
(2)直方图均衡化,优化对比度受限的自适应直方图均衡
(3)
直方图可以视为图形或曲线图,从而可以总体了解图像的强度分布。它是在X轴上具有像素值(不总是从0到255的范围),在Y轴上具有图像中相应像素数的图。
cv2.calcHist(images, channels, mask, histSize, ranges[, hist[, accumulate]])
- images: 源图像
- channels: 图像通道,灰度图0,彩色RGB
- mask:要分析的蒙版区域
- histSize:x轴的分组数
- ranges:x轴的范围
Numpy计算直方图
hist, bins = np.histogram(img.ravel(), 256, [0, 256])
np.bincount() 比 np.histogram() 快10倍
hist2 = np.bincount(img.ravel(), minlength=256)
OpenCV函数比np.histogram() 快(大约40倍),因此坚持使用OpenCV功能。
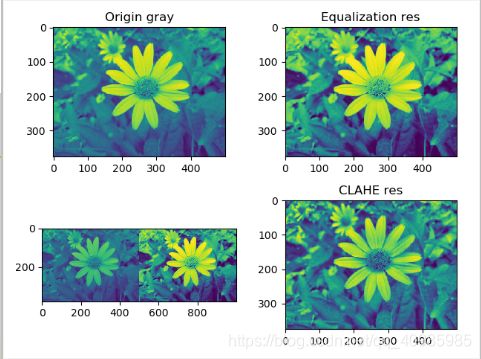
直方图均衡化: 使图像像素更平均一些;
直方图均衡化的一个弊端:对于区域比较大且同时包含较亮、较暗的区域时,效果不好,优化是使用CLAHE;
CLAHE(Contrast Limited Adaptive Histogram Equalization) 对比度受限的自适应直方图均衡
对于细节方面将保留的更多 相当于在每一个8*8像素区域内均衡
# 直方图均衡化: 使图像像素更平均一些;
# 直方图均衡化的一个弊端:对于区域比较大且同时包含较亮、较暗的区域时,效果不好,优化是使用CLAHE
# CLAHE(Contrast Limited Adaptive Histogram Equalization) 对比度受限的自适应直方图均衡
# 对于细节方面将保留的更多 相当于在每一个8*8像素区域内均衡

import cv2
import numpy as np
from matplotlib import pyplot as plt

img = cv2.imread('D:/imageProcessing/input/flower2.jpg', 0)

hist, bins = np.histogram(img.flatten(), 256, [0, 256])

cdf = hist.cumsum()
cdf_normalized = cdf * hist.max() / cdf.max()

plt.plot(cdf_normalized, color='b')
plt.hist(img.flatten(), 256, [0, 256], color='r')
plt.xlim([0, 256])
plt.legend(('cdf', 'histogram'), loc='upper left')
plt.show()

# cdf
cdf_m = np.ma.masked_equal(cdf, 0)
cdf_m = (cdf_m - cdf_m.min()) * 255 / (cdf_m.max() - cdf_m.min())
cdf = np.ma.filled(cdf_m, 0).astype('uint8')
img2 = cdf[img]
plt.subplot(221), plt.imshow(img, cmap=plt.cm.gray)
plt.subplot(222), plt.imshow(img2, 'gray')
plt.subplot(223), plt.imshow(img)
plt.subplot(224), plt.imshow(img2)
plt.show()

# openCV中的直方图均衡
img = cv2.imread('D:/imageProcessing/input/flower2.jpg', 0)
equ = cv2.equalizeHist(img)
res = np.hstack((img, equ))  # stacking images side-by-side
plt.subplot(221), plt.imshow(img), plt.title('Origin gray')
plt.subplot(222), plt.imshow(equ), plt.title('Equalization res')
plt.subplot(223), plt.imshow(res)

# CLAHE(Contrast Limited Adaptive Histogram Equalization) 对比度受限的自适应直方图均衡
# 对于细节方面将保留的更多 相当于在每一个8*8像素区域内均衡
img = cv2.imread('D:/imageProcessing/input/flower2.jpg', 0)
# create a CLAHE object (Arguments are optional).
clahe = cv2.createCLAHE(clipLimit=2.0, tileGridSize=(8, 8))
cl1 = clahe.apply(img)
plt.subplot(224), plt.imshow(cl1), plt.title('CLAHE res')
plt.show()


