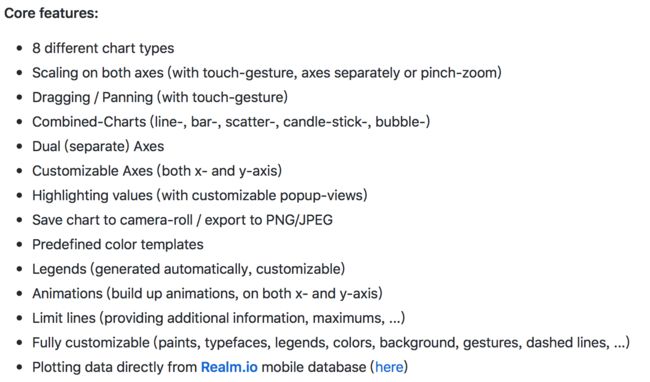
给大家分享一个关于折线图的第三方框架 是一个关于图表的框架 在github上面拥有16.8k的星星数 是一个非常不错的框架
附上核心功能
下面给大家介绍下折线图的使用
我使用pod集成的charts
在使用的过程中遇到不少问题,希望大家看过之后可以少走一些弯路
一:集成
在podfile中添加
pod 'Charts'
pod 'ChartsRealm'
注意他是一个swift框架所以要添加
use_frameworks!
ps:有的时候可能集成的很慢请耐心等待
集成下来以后会报很多错误,大概就是说swift版本的问题
那我们就需要设置一下版本
然后接下来就可以去项目中使用它了
二:使用
由于它是一个swift框架所以需要创建一个桥接文件
首先创建一个swift文件,创建的时候会弹出下面的弹窗
点击最后一个就可以了
到此 前面的准备工作就告一段落了 接下来就进入写代码的时候了
折线图
折线图的LineChartView
//折线图
@property (nonatomic,strong) LineChartView * lineView;//折线图
@property (nonatomic,strong) UILabel * markY;
@property (nonatomic, strong) LineChartDataSet *set1;//折线
@property (nonatomic, strong) LineChartDataSet *set2;
//折线图
- (UILabel *)markY{
    if (!_markY) {
        _markY = [[UILabel alloc]initWithFrame:CGRectMake(0, 0, 35, 25)];
        _markY.font = [UIFont systemFontOfSize:15.0];
        _markY.textAlignment = NSTextAlignmentCenter;
        _markY.text =@"";
        _markY.textColor = [UIColor whiteColor];
        _markY.backgroundColor = [UIColor grayColor];
    }
    return _markY;
}

- (LineChartView *)lineView {
    if (!_lineView) {
        _lineView = [[LineChartView alloc] initWithFrame:CGRectMake(20, 40, kScreenWidth - 40, kScreenHeight - 160)];
        _lineView.delegate = self;//设置代理
        _lineView.backgroundColor =  [UIColor whiteColor];
        _lineView.noDataText = @"暂无数据";
        _lineView.chartDescription.enabled = YES;
        _lineView.scaleYEnabled = NO;//取消Y轴缩放
        _lineView.doubleTapToZoomEnabled = NO;//取消双击缩放

        _lineView.dragEnabled = NO;//启用拖拽图标
        _lineView.userInteractionEnabled = YES;
        _lineView.dragDecelerationEnabled = NO;//拖拽后是否有惯性效果

        _lineView.dragDecelerationFrictionCoef = 0.9;//拖拽后惯性效果的摩擦系数(0~1),数值越小,惯性越不明显
        //设置滑动时候标签
        ChartMarkerView *markerY = [[ChartMarkerView alloc]
                                    init];
        markerY.offset = CGPointMake(-999, -8);
        markerY.chartView = _lineView;
        _lineView.marker = markerY;
        [markerY addSubview:self.markY];
        _lineView.rightAxis.enabled = NO;//不绘制右边轴
        ChartYAxis *leftAxis = _lineView.leftAxis;//获取左边Y轴
        //        leftAxis.labelCount = 6;//Y轴label数量,数值不一定,如果forceLabelsEnabled等于YES, 则强制绘制制定数量的label, 但是可能不平均
        leftAxis.forceLabelsEnabled = NO;//不强制绘制指定数量的label
        leftAxis.axisMinValue = 0;//设置Y轴的最小值
        leftAxis.axisMaxValue = 100;//设置Y轴的最大值
        leftAxis.inverted = NO;//是否将Y轴进行上下翻转
        leftAxis.axisLineColor = [UIColor blackColor];//Y轴颜色
        leftAxis.valueFormatter = [[SymbolsValueFormatter alloc]init];
        leftAxis.labelPosition = YAxisLabelPositionOutsideChart;//label位置
        leftAxis.labelTextColor = [UIColor blackColor];//文字颜色
        leftAxis.labelFont = [UIFont systemFontOfSize:10.0f];//文字字体
        leftAxis.gridColor = [UIColor lightGrayColor];//网格线颜色
        leftAxis.gridAntialiasEnabled = NO;//开启抗锯齿

        ChartXAxis *xAxis = _lineView.xAxis;
        xAxis.granularityEnabled = YES;//设置重复的值不显示
        xAxis.labelPosition= XAxisLabelPositionBottom;//设置x轴数据在底部
        xAxis.gridColor = [UIColor clearColor];
        xAxis.labelTextColor = [UIColor blackColor];//文字颜色
        xAxis.axisLineColor = [UIColor grayColor];
        xAxis.labelCount = 31;
        xAxis.axisMinimum = 1;
        xAxis.axisMaximum = 31;
        _lineView.maxVisibleCount = 999;//
        //描述及图例样式
        [_lineView setDescriptionText:@""];
        _lineView.legend.enabled = NO;

        BalloonMarker *marker = [[BalloonMarker alloc]
                                 initWithColor: [UIColor colorWithWhite:180/255. alpha:1.0]
                                 font: [UIFont systemFontOfSize:12.0]
                                 textColor: UIColor.whiteColor
                                 insets: UIEdgeInsetsMake(8.0, 8.0, 20.0, 8.0)];
        marker.chartView = _lineView;
        marker.minimumSize = CGSizeMake(80.f, 40.f);
        _lineView.marker = marker;
//        _lineView.legend.form = ChartLegendFormLine;

        [_lineView animateWithXAxisDuration:1.0f];

    }
    return _lineView;
}
在对应的地方添加上即可
[self.view addSubview:self.lineView];
添加完后我们需要输入数据
- (LineChartData *)setData{

    //对应Y轴上面需要显示的数据
    NSMutableArray *yVals = [[NSMutableArray alloc] init];

    for (int i = 0; i < xVals_count; i++) {
        int a = arc4random() % 100;
        ChartDataEntry *entry = [[ChartDataEntry alloc] initWithX:i y:a];
        [yVals addObject:entry];
    }

    _set1 = nil;
    if (_lineView.data.dataSetCount > 0) {
        LineChartData *data = (LineChartData *)_lineView.data;
        _set1 = (LineChartDataSet *)data.dataSets[0];
        _set1.values = yVals;
        _set1.valueFormatter = [[SetValueFormatter alloc]initWithArr:yVals];
        return data;
    }else{
        //创建LineChartDataSet对象
        _set1 = [[LineChartDataSet alloc]initWithValues:yVals label:nil];
        //设置折线的样式
        _set1.lineWidth = 3.0/[UIScreen mainScreen].scale;//折线宽度
        _set1.drawValuesEnabled = NO;//是否在拐点处显示数据
        _set1.valueFormatter = [[SetValueFormatter alloc]initWithArr:yVals];

        _set1.valueColors = @[[UIColor colorWithHexString:@"#E88C39" alpha:1.0]];//折线拐点处显示数据的颜色
        _set1.circleRadius = 3;
        [_set1 setDrawCirclesEnabled:YES];
        [_set1 setCircleColor:[UIColor colorWithHexString:@"#E88C39" alpha:1.0]];
        [_set1 setColor:[UIColor colorWithHexString:@"#E88C39" alpha:1.0]];//折线颜色
        _set1.highlightColor = [UIColor colorWithHexString:@"#E88C39" alpha:1.0];
        _set1.drawSteppedEnabled = NO;//是否开启绘制阶梯样式的折线图
        //折线拐点样式
        _set1.drawCirclesEnabled = YES;//是否绘制拐点
        _set1.drawFilledEnabled = NO;//是否填充颜色

        //将 LineChartDataSet 对象放入数组中
        _dataSets = [[NSMutableArray alloc] init];

        [_dataSets addObject:_set1];


        //添加第二个LineChartDataSet对象

        NSMutableArray *yVals2 = [[NSMutableArray alloc] init];
        for (int i = 0; i <  xVals_count; i++) {
            int a = arc4random() % 80;
            ChartDataEntry *entry = [[ChartDataEntry alloc] initWithX:i y:a];
            [yVals2 addObject:entry];
        }
        _set2 = [_set1 copy];

        _set2.values = yVals2;
        _set2.drawValuesEnabled = NO;
        [_set2 setColor:[UIColor colorWithRed:0/255.0 green:199/255.0 blue:181/255.0 alpha:1/1.0]];
        [_set2 setCircleColor:[UIColor colorWithRed:0/255.0 green:199/255.0 blue:181/255.0 alpha:1/1.0]];

        _set2.highlightColor = [UIColor colorWithRed:0/255.0 green:199/255.0 blue:181/255.0 alpha:1/1.0];
        [_dataSets addObject:_set2];


        //创建 LineChartData 对象, 此对象就是lineChartView需要最终数据对象
        LineChartData *data = [[LineChartData alloc]initWithDataSets:_dataSets];
        [data setValueFont:[UIFont fontWithName:@"HelveticaNeue-Light" size:11.f]];//文字字体
        [data setValueTextColor:[UIColor blackColor]];//文字颜色


        return data;
    }

}
在添加完成后调用即可
self.lineView.data = [self setData];
不要忘记代理方法
- (void)chartValueSelected:(ChartViewBase * _Nonnull)chartView entry:(ChartDataEntry * _Nonnull)entry highlight:(ChartHighlight * _Nonnull)highlight {

    _markY.text = [NSString stringWithFormat:@"%ld%%",(NSInteger)entry.y];
    //将点击的数据滑动到中间
    [_lineView centerViewToAnimatedWithXValue:entry.x yValue:entry.y axis:[_lineView.data getDataSetByIndex:highlight.dataSetIndex].axisDependency duration:1.0];


}
- (void)chartValueNothingSelected:(ChartViewBase * _Nonnull)chartView {


}
如果你想添加一条折线的话
//添加折线
- (void)click:(UIColor *)color Button:(BSWColorButton *) btn {

    NSMutableArray *yVals2 = [[NSMutableArray alloc] init];
    for (int i = 0; i <  xVals_count; i++) {
        int a = arc4random() % 80;
        ChartDataEntry *entry = [[ChartDataEntry alloc] initWithX:i y:a];
        [yVals2 addObject:entry];
    }
    LineChartDataSet *set2 = [_set1 copy];

    set2.values = yVals2;
    set2.drawValuesEnabled = NO;
    set2.highlightColor = color;
    [set2 setColor:color];
    [set2 setCircleColor:color];
    [_dataSets addObject:set2];
    //创建 LineChartData 对象, 此对象就是lineChartView需要最终数据对象
    LineChartData *data = [[LineChartData alloc]initWithDataSets:_dataSets];
    [data setValueFont:[UIFont fontWithName:@"HelveticaNeue-Light" size:11.f]];//文字字体
    [data setValueTextColor:[UIColor blackColor]];//文字颜色
    self.lineView.data = data;
}
移除一个折线
- (void)removeDataSet:(BSWColorButton *)sender {
    [_dataSets removeObject:sender.set];
    //创建 LineChartData 对象, 此对象就是lineChartView需要最终数据对象
    LineChartData *data = [[LineChartData alloc]initWithDataSets:_dataSets];
    [data setValueFont:[UIFont fontWithName:@"HelveticaNeue-Light" size:11.f]];//文字字体
    [data setValueTextColor:[UIColor blackColor]];//文字颜色
    self.lineView.data = data;
}
效果图
附上传送门:https://github.com/danielgindi/Charts
希望你们少走弯路!


